How to measure food experience in a managed dining environment
Measuring food experience means capturing how guests feel about a meal and reading it alongside your operational data. This guide walks through the common methods, the metrics worth tracking, how often to review them and, most importantly, how to interpret what you find.
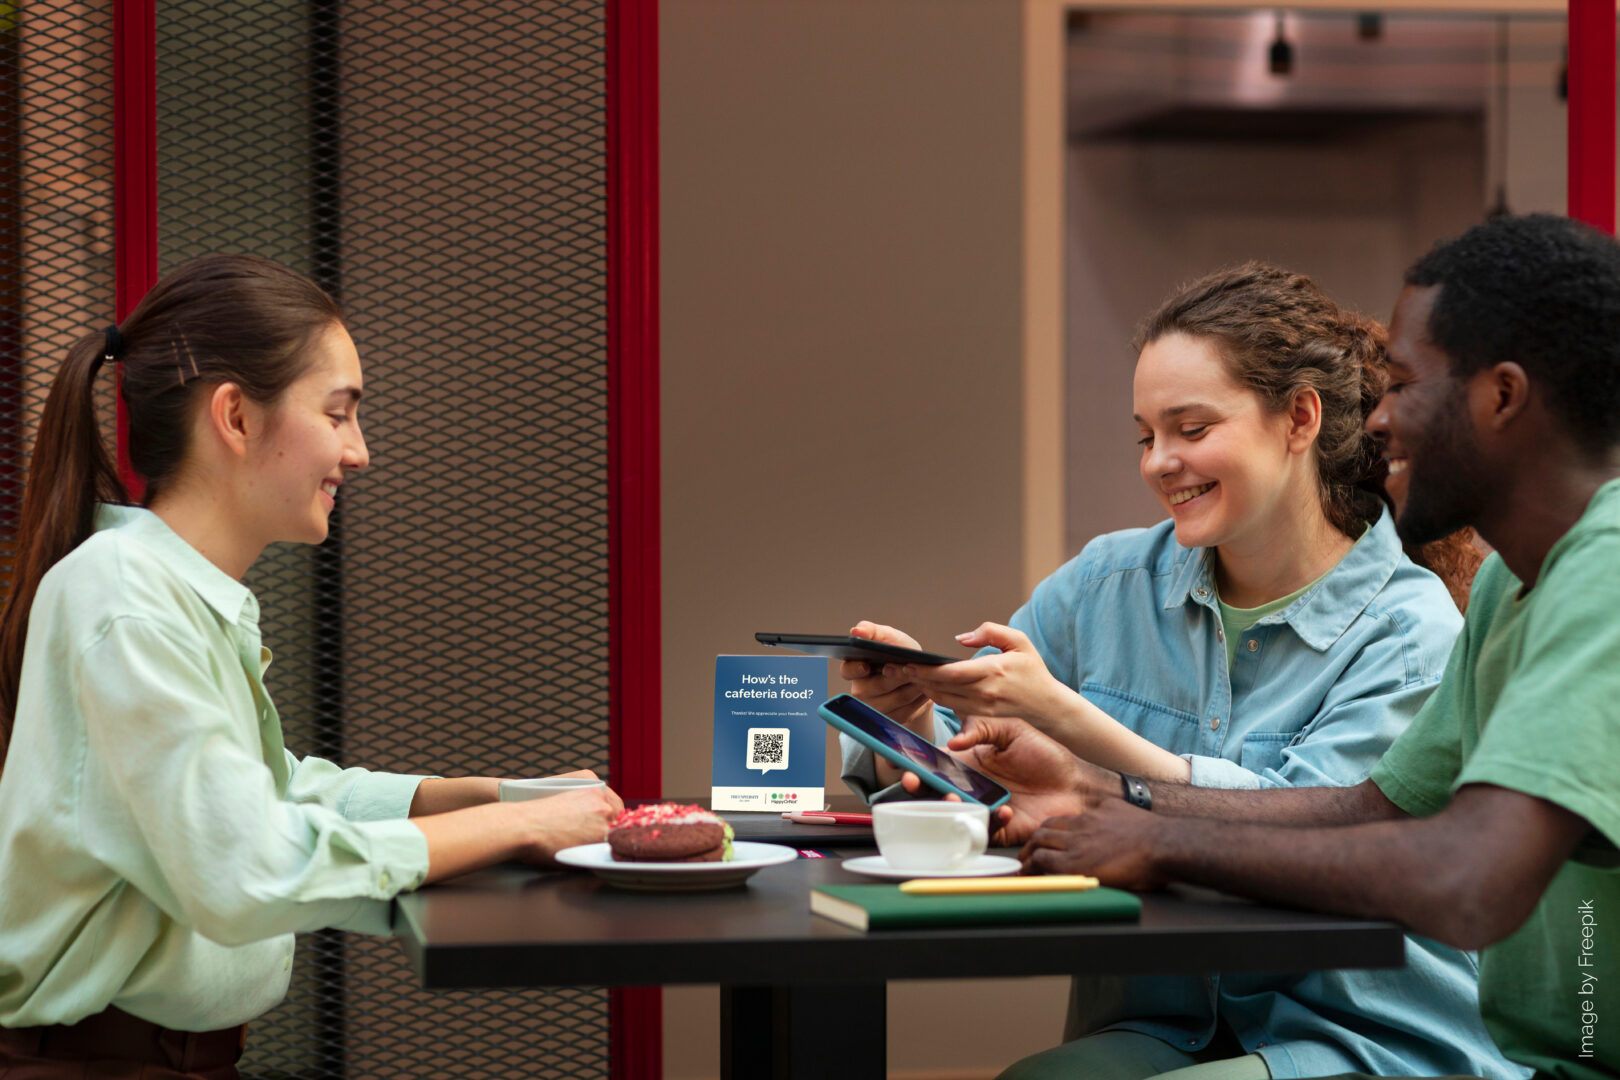
Measuring food experience is, at heart, about understanding how guests feel about their meal, and doing it often enough and precisely enough to act. Operational data tells you whether the service ran; measuring the experience adds the missing half, how it landed with the people eating. This guide looks at the methods operators use, the metrics worth watching, how often to review them and how to make sense of the results.
Most dining teams already gather some feedback. The limitation is usually not effort but timing and reach: an infrequent or periodic survey gives real depth, yet it arrives long after the meals it describes and reaches only the people who respond. Adding lighter, more frequent signals closer to the moment fills that gap. The aim is a fuller picture, not a replacement for what you already do.
Why measuring food experience is different from measuring food service
Food service is measured mostly in operational outputs: meals produced, cost per cover, waste, compliance. Those numbers tell you whether the operation ran, and they can hint at how the experience felt, since long waits or frequent stockouts often track with lower satisfaction. What they do not do is capture sentiment directly. Food experience has to be read from how guests felt about the food, the wait, the service and the space, gathered close enough to the moment to stay accurate.
The two overlap and are best read together. Operational metrics provide useful signals and context; experience data explains how those conditions were received. For the fuller distinction, see our guide on food service versus food experience. Because sentiment fades quickly, varies by site and hour, and becomes most useful in volume, measuring it well tends to reward methods that are timely, regular and granular.
| Operational metrics | Experience signals |
|---|---|
| Meals produced, covers served | How guests felt about the meal |
| Cost per cover, food cost % | Perceived value and quality |
| Wait times, stockouts, compliance | Speed, service, cleanliness and atmosphere as experienced |
| Show whether the operation ran | Show how the operation was received |
Neither column is the whole story. A strong operational report and a lukewarm lunchtime can occur together, which is exactly why reading the two side by side is more useful than relying on either alone.
Common ways to measure food experience
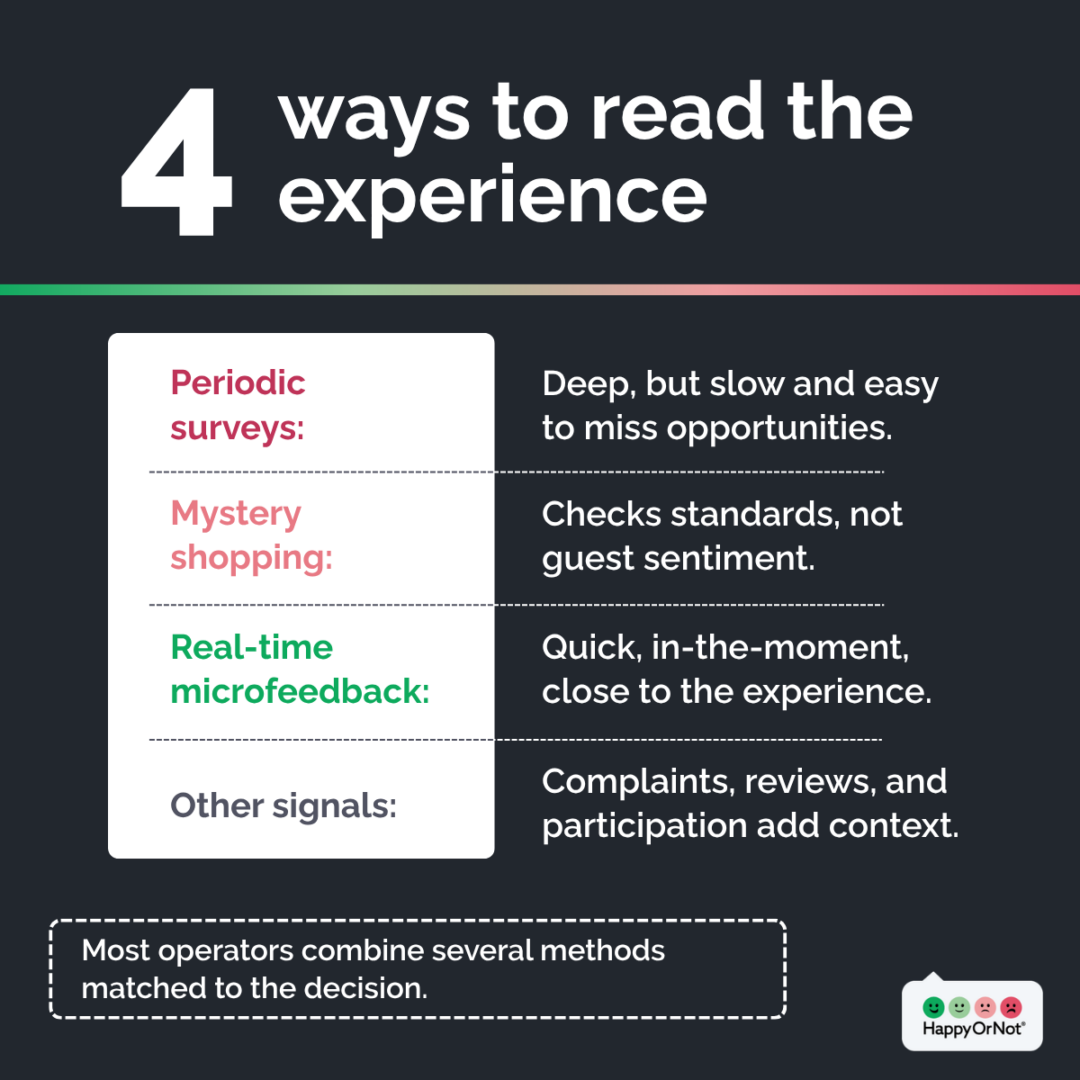
Operators draw on several methods, and most use more than one. The four below are among the most common, but they are not the only options: complaints, interviews, focus groups, online reviews and participation data all add useful context. The right mix depends on what you need to learn and how quickly.
Periodic surveys
Detailed questionnaires sent at intervals, whether monthly, termly or less often. They are strong on depth and good for understanding the “why” behind a trend or benchmarking across a year. Their limitation is timeliness and reach: email survey response rates have fallen from around 20 to 25 percent in 2019 to 10 to 15 percent in 2025 (User Intuition, a customer research firm), and one practitioner survey reports an average nearer 8.6 percent (reported by Retently). By the time results are analyzed, the meals they describe may be weeks past.
Mystery shopping and audits
A trained visitor assesses a site against a checklist. This is useful for auditing standards and catching issues a guest might not report, though it is designed to assess standards and observed behaviors against a checklist rather than to represent the sentiment of thousands of guests, and it is relatively expensive and low in volume.
Real-time microfeedback
Short responses captured at or just after the moment of experience, often a quick sentiment tap with the option to add a comment. Because it is low-friction, it can gather feedback frequently and close to the experience, which helps surface patterns by site, day and meal. How much volume it generates depends on footfall and placement, so it is best thought of as a way to read the experience continuously rather than a guaranteed flood of responses. The concept is explained more fully in What Is Microfeedback? A Guide for Food Service Operators.
Other signals
Complaints, online reviews, participation figures and direct conversations with diners all round out the picture. None is complete on its own, but together they help triangulate what guests are really experiencing.
One practical approach is to use real-time feedback for day-to-day management and periodic surveys for deeper analysis. Relying on infrequent surveys alone is the main limitation to watch for, because it leaves long gaps where issues can go unseen.
How to measure food experience in a cafeteria: a step-by-step method
Here is a practical sequence for standing up continuous measurement. Treat it as a flexible framework rather than a fixed formula, since the best choices depend on your sites and your goals.
Step 1: Define what you need to decide
Start from the decisions you want to support, such as which dishes to change, when to add staff or which site needs help. Measurement should serve a decision, not fill a dashboard.
Step 2: Choose touchpoints that fit the experience
Place feedback points where they match what you are measuring and where guests can realistically respond. The exit from the food hall often works well for an overall read, while a specific counter suits feedback on a particular station. The best touchpoint depends on the experience in question and the moment a guest is free to react.
Step 3: Pick a collection method to match
Choose the method before the product, guided by practical criteria: how much traffic passes the point, how long guests dwell there, the physical environment, whether you want written comments, and whether guests have easy digital access. With those settled, the fit becomes clear. A Smiley Terminal or Smiley Touch suits busy physical points, Smiley Sign, which is QR- and NFC-enabled signage that lets guests respond on their own phones, suits places where hardware is impractical, and Smiley Digital fits pre-order apps and online ordering.
Step 4: Ask a question that fits the moment
Match the question to the touchpoint and to what you want to learn. A broad “how was your meal today?” works at the exit, while a station might ask specifically about the dish or the wait. Keeping it short protects response rates, and an optional follow-up lets guests add context when they want to.
Step 5: Connect every signal to time and place
Tag each response by site, area and time so a dip can be traced to a specific meal, hour or location, the difference between “satisfaction is down” and “satisfaction at Site 4 dips on Thursdays around 1 p.m.”
Step 6: Set a review cadence
Review often enough to act, and match the rhythm to the decision. Frontline teams may glance at signals daily for quick fixes; a site manager might look weekly for recurring patterns; a regional or portfolio lead might review monthly or quarterly for longer-term trends. The right cadence is the one that fits the decision, not a single universal schedule.
Step 7: Act with named owners and close the loop
Give each issue a clear owner and show guests and staff what changed. Closing the loop helps sustain participation, and it also signals that feedback is taken seriously, which builds trust and confidence in the process over time.
What to measure, and how to read it
Feedback becomes useful when you track the right things and know how to interpret them. It helps to separate two kinds of measure: feedback metrics, which capture sentiment, and business-outcome metrics such as participation, which sit alongside feedback rather than being a substitute for it.
- A summary sentiment score. A headline read on how guests feel, useful for tracking a site over time and comparing across locations. HappyOrNot summarises sentiment with the Happy Index, a weighted average of its four-button scale expressed on a 0 to 100 range, which gives teams a single figure to follow.
- Drivers and comments. The reasons behind the score, drawn from optional comments and follow-up responses, which point to what to actually change.
- Trends over time. The direction of travel, which matters more than any single reading, and which shows whether a change worked.
- Response volume and context. How many responses sit behind a figure, so you can judge how much weight to give it, especially at quieter sites.
- Site and segment comparisons. How locations, dayparts or stations compare, so you can spread what works and support what lags.
- Participation. How many eligible diners choose to eat, a business outcome that is worth reading next to sentiment rather than treated as the same measure.
Interpreting the data matters as much as collecting it. Set a baseline before judging change, be cautious with small numbers of responses, compare like with like across sites, and treat a single reading as a prompt to look closer rather than a verdict. We go deeper on this in our guide to KPIs for food service guest experience.
Turning measurement into action: an example
Measurement only earns its keep when it changes something. ISS, the global facilities and food services company, introduced real-time feedback across its dining operations and treated the results as an operational tool, reviewing them regularly and adjusting the menu in response. The team removed dishes that consistently scored poorly and shared results with diners, and reported a rise of around 20 percent in customer satisfaction over the first six months.
The City of Järvenpää shows the same idea in school dining. Rotating feedback terminals gathered roughly 38,000 responses over 12 weeks, giving the team dish-level scores they now review weekly with their food provider, which turned an occasional survey into an ongoing conversation.
See how each site is really performing
HappyOrNot helps food service operators capture guest feedback at the point of service and spot the patterns worth acting on, so teams can respond faster and check whether a change worked. Explore our food service solutions.