Food service experience in Q3 2026: where dining pressure builds
Built on 1.9 million in-the-moment dining feedback responses, the Q3 Food Service CX Pulse reveals where dining performance is strongest, where friction persists and when pressure builds.
Food service customer experience remained strong in Q3, but the operating picture underneath the headline score was uneven.
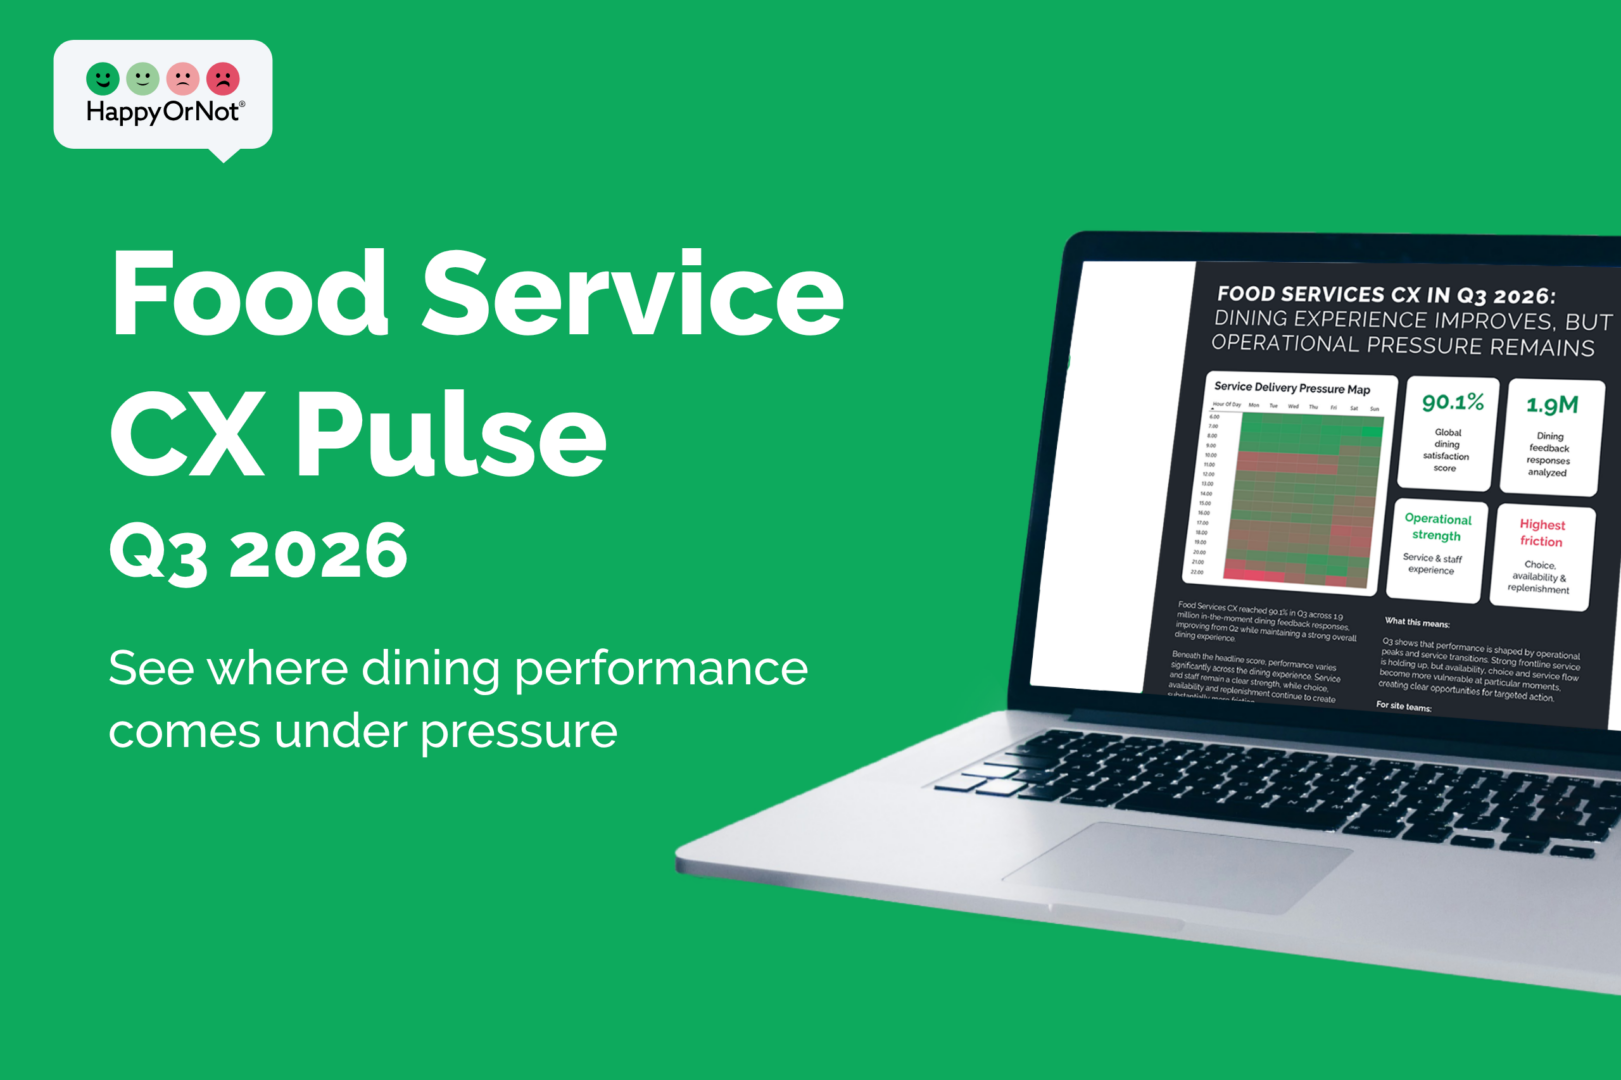
Global dining satisfaction reached 90.1%, up from 89.5% in Q2. The improvement was supported by a higher share of Very Happy responses, but individual operational areas moved in different directions.
That’s one of the clearest findings from the Q3 2026 Food Services CX Pulse. Built on 1.9 million in-the-moment dining feedback responses, the report looks beyond the average to show where the dining experience is strongest, where execution remains vulnerable and when pressure emerges across the service day.
Service & staff experience remains a clear strength. Choice, availability & replenishment sits much lower, while food quality & menu execution also lost ground from Q2.
For food service operators, that makes consistency the more useful operational question. The goal is not simply to maintain a strong average, but to understand where the lived dining experience changes across operational areas and service periods. Q3 shows why food experience is an operational challenge as much as a satisfaction measure.
Dining satisfaction improved, but the gains were uneven
A 90.1% global dining satisfaction score represents a strongly positive experience overall. The movement from Q2 is also positive, but it does not mean every part of the operation improved.
Very Happy responses increased from 77.2% to 78.3%, while Very Unhappy responses fell from 6.9% to 6.5%. Together, those shifts show improvement at both ends of the response distribution.
For food service operations leaders, the distinction matters. Some of the strongest areas improved further, led by service & staff experience. At the same time, choice, availability & replenishment and food quality & menu execution weakened.
The operational task is therefore to protect the strengths already working while focusing attention on the areas where diner expectations are still harder to meet.
The operational benchmarks reveals a clear divide
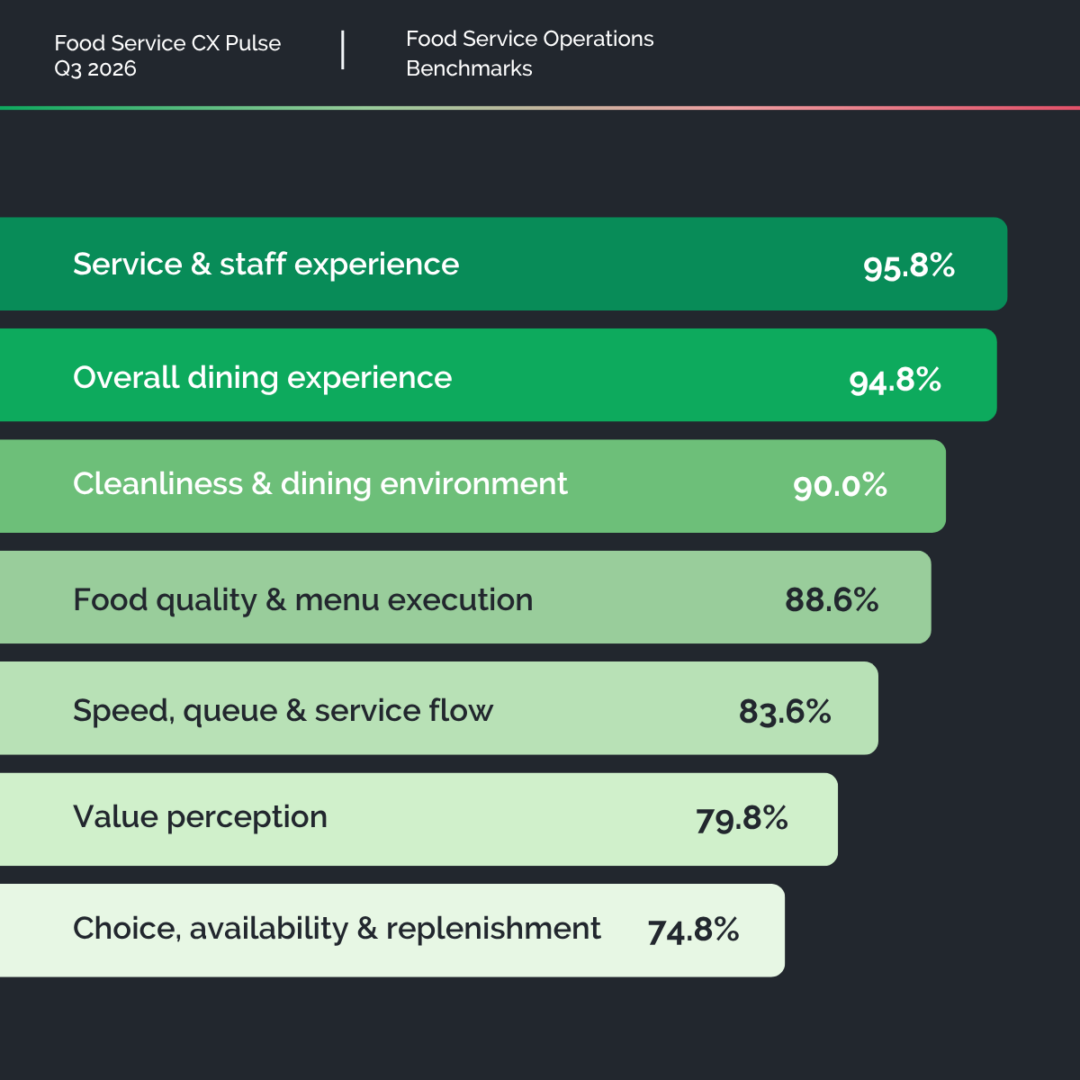
Q3 shows a clear divide between strong frontline delivery and weaker food and menu execution. That makes the benchmark useful not simply as a ranking, but as a guide to where action should focus.
Service & staff experience leads the benchmark at 95.8%. Strong service, friendliness and staff availability continue to protect the dining experience when operations come under pressure.
Overall dining experience also remains strong at 94.8%, while cleanliness & dining environment reached 90.0%. These are important strengths for operators to protect.
Elsewhere, the picture is more challenging.
Choice, availability & replenishment is the lowest-rated area at 74.8%. Availability is the standout weakness, with positive feedback falling below half, while weaker selection shows that the issue is not simply having enough food but giving diners access to the choices they expect.
Food quality & menu execution reached 88.6%. Quality itself remains relatively strong, but portion size creates more friction, showing that the food experience depends on more than quality alone.
For operators, the priority is to close the gap between strong frontline delivery and weaker food execution. Protect service strengths while focusing operational attention on availability, choice and menu execution. Timing adds another layer, because the dining experience does not come under pressure evenly throughout the day.
The Service Delivery Pressure Map shows when consistency is tested
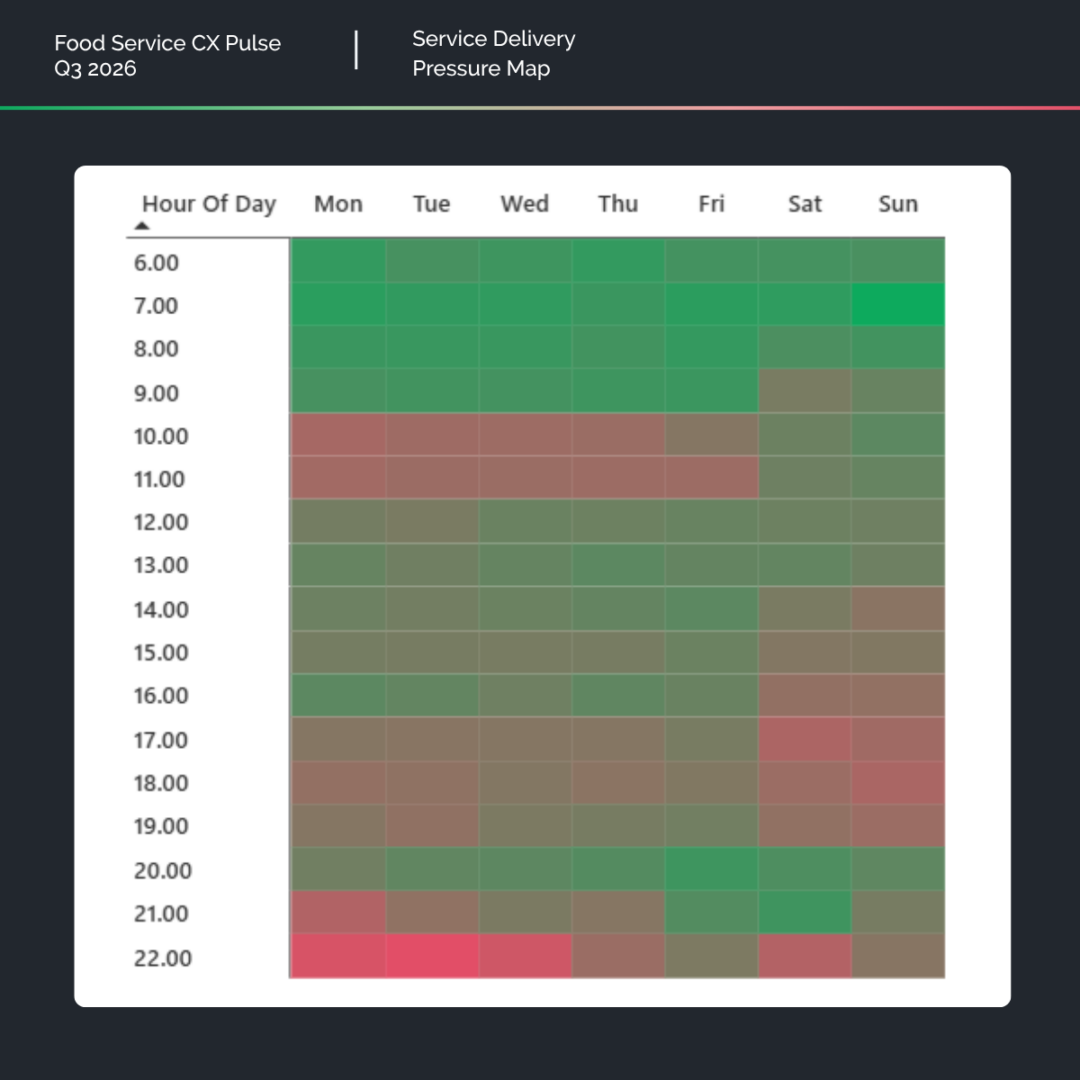
The Q3 Service Delivery Pressure Map shows that dining performance does not simply weaken as the day progresses. By combining hour and weekday, the map reveals recurring service windows where the dining experience becomes more vulnerable. Pressure emerges in the late morning and again during the early evening, with stronger periods in between.
Dining satisfaction falls sharply at 10:00 and remains low at 11:00. Performance then recovers from 12:00 to 14:00 despite high feedback volumes, before weakening again from 17:00 to 19:00.
Recurring pressure windows give operators a clearer starting point for investigation and action. Preparation, staffing, availability and replenishment can be reviewed around those windows, then the same periods can be tracked to see whether changes improve performance. That’s the difference between seeing a quarterly score and understanding the operating pattern behind it.
Why operational patterns matter more than average scores
Average dining satisfaction tells operators where performance landed. Operational patterns show where action is most likely to make a difference.
A food service operation can maintain a strong overall score while still experiencing recurring periods or touchpoints where the dining experience weakens. Q3 makes those hidden pressure points visible. That allows site teams to move from broad improvement initiatives to more targeted action, while regional and account leaders can distinguish isolated issues from wider patterns across services and locations.
The goal is not simply to collect more feedback. It is to turn real-time microfeedback into clear signals that help teams act where and when the dining experience is most vulnerable.
Three priorities for stronger food service execution
The Q3 findings point to three priorities for operators looking to protect strong dining satisfaction while improving consistency.
- Prepare for service transitions: Use recurring pressure windows to guide preparation, staffing and availability, then track whether performance improves.
- Protect availability and choice: Availability remains the clearest operational weakness. Review preparation and replenishment around pressure windows so menu choice holds up throughout service.
- Learn from stronger periods: Compare stronger service periods with weaker ones to identify practices that can be applied where performance falls short.
The strongest food service operations use recurring feedback signals to focus action, recognize what works and measure whether changes improve the dining experience.
Consistency is what turns good service into a stronger food experience
Food experience isn’t defined by one score or one interaction. It is shaped by the combination of service, food, environment, availability and flow across every service period.
The Q3 Food Services CX Pulse shows that strong frontline service provides a resilient foundation, but availability and menu execution can still create significant friction for diners.
For operators, the opportunity is to connect dining feedback more closely to the daily operating rhythm: identify the signal, act where it matters and track whether performance changes. That is how in-the-moment feedback becomes practical evidence of a more consistent dining experience.
Download the Q3 Food Services CX Pulse
Download the Q3 Food Services CX Pulse to benchmark dining performance, see where operational pressure emerges and identify practical opportunities to strengthen the food experience.