What you’ll learn
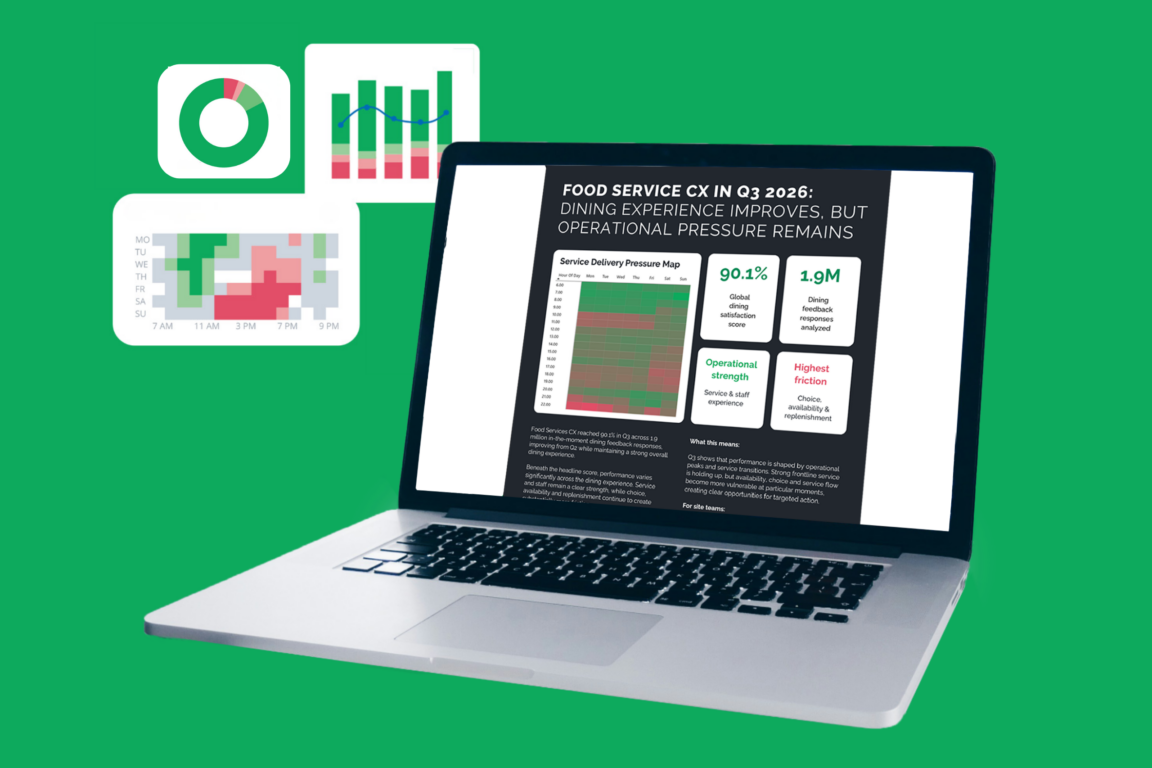
The Q3 Food Services CX Pulse goes beyond the headline dining satisfaction score to reveal the operational signals behind the food experience. You’ll discover:
- How dining performance moved from Q2 to Q3
- Which operational areas strengthened or weakened
- Where the dining experience remains most vulnerable
- When pressure builds across the service day
- What food service operators should prioritize next
See where service delivery comes under pressure
Strong overall dining satisfaction can hide the moments when execution becomes harder to sustain.
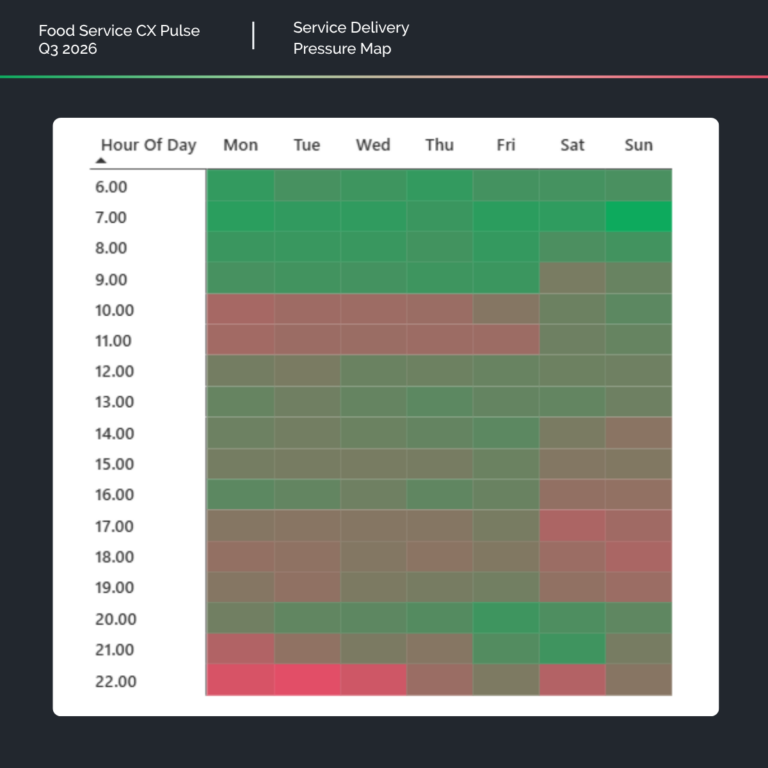
The Service Delivery Pressure Map shows how dining satisfaction changes across hours and days, revealing recurring periods of operational pressure that a headline score cannot show.
By identifying when performance is most vulnerable, operators can better focus preparation, staffing, availability and replenishment on the service windows that need attention.
Key insights from Q3
- Global dining satisfaction reached 90.1%.
- Service & staff experience leads the operational benchmark at 95.8%.
- Choice, availability & replenishment remains the clearest pressure at 74.8%.
- Dining performance weakens during recurring late-morning and early-evening windows.
- Operators can use recurring signals to focus action and track whether changes improve performance.
Why it matters
Strong food service performance is not simply about achieving a high average score.
The bigger operational challenge is maintaining the dining experience across locations, service periods and changing conditions. Understanding where performance holds up and where it becomes vulnerable helps operators focus action on the moments and operational areas that need it most.
The Q3 Food Services CX Pulse helps leaders benchmark performance, identify recurring pressure points and prioritize practical action across the dining operation.
Trusted by leading food service operators
HappyOrNot helps food service operators capture real-time microfeedback at the point of experience and turn it into clear operational signals. Teams can see where performance changes, act on recurring issues and track whether improvements are working across sites and service periods.