Retail CX in Q3: what it takes to sustain strong store performance
Learn how Q3 retail CX benchmarks reveal the operational strengths, friction points, and trading-week patterns that matter for sustaining strong store performance.
Strong store performance is one thing. Sustaining it across every trading day is another.
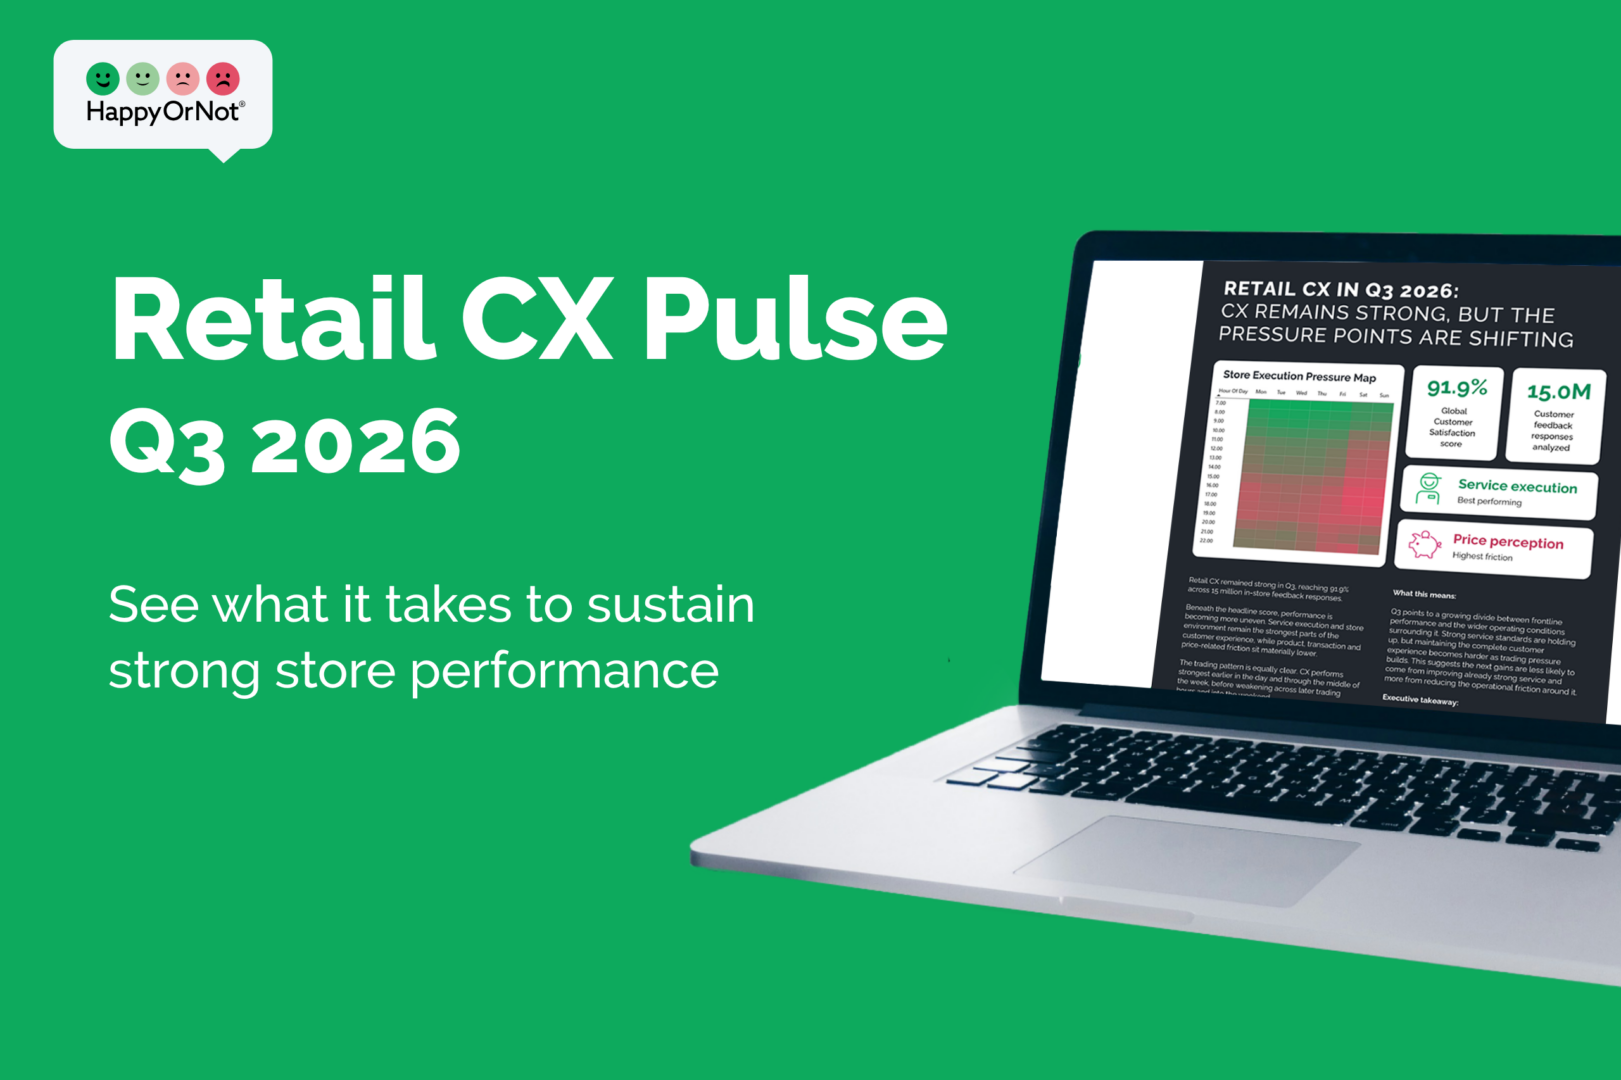
Global retail CX reached 91.9% in Q3, down 0.5 percentage points from Q2. The headline result remains strong, but the more useful operational question is what enables retailers to maintain that performance as conditions change.
Built on 15 million real in-store customer feedback responses, the Q3 2026 Retail CX Pulse explores which operational strengths retailers can protect, where friction remains, and how customer satisfaction changes throughout the trading week.
The findings show why a high average is only part of the picture. Excellent frontline service can coexist with weaker product availability, transaction experiences, or value perception. For customers, these are not separate metrics: they form one store visit.
For retail leaders, sustaining performance means connecting those parts of the operation, recognizing recurring differences, and using customer feedback to prioritize the improvements that matter. The opportunity is not simply to lift the average – it is to make strong execution more repeatable.
Strong overall retail CX does not guarantee consistent execution
A 91.9% global CX score represents a strongly positive in-store experience. Yet the quarter-on-quarter sentiment distribution suggests a modest shift away from the very highest level of satisfaction.
Very Happy responses fell from 83.3% in Q2 to 82.8% in Q3. Happy responses edged up to 9.2%, while Unhappy and Very Unhappy responses increased slightly to 2.7% and 5.3% respectively. The movement is modest, but it shows that fewer visits reached the strongest level of satisfaction.
That distinction matters for operations leaders: the objective is not to interpret a small movement as widespread failure, but to understand where the customer experience can be strengthened.
A strong quarterly average may conceal differences across operational areas, stores, and trading periods. These are the differences that determine where management attention can be most useful. The Q3 benchmark provides a starting point for identifying what is working well and where sustained execution requires more support.
Protect operational strengths while addressing friction elsewhere
The Q3 operational benchmark shows why sustaining store performance is a cross-functional challenge. Some areas improved, while others softened, creating distinct priorities for retail operations leaders.
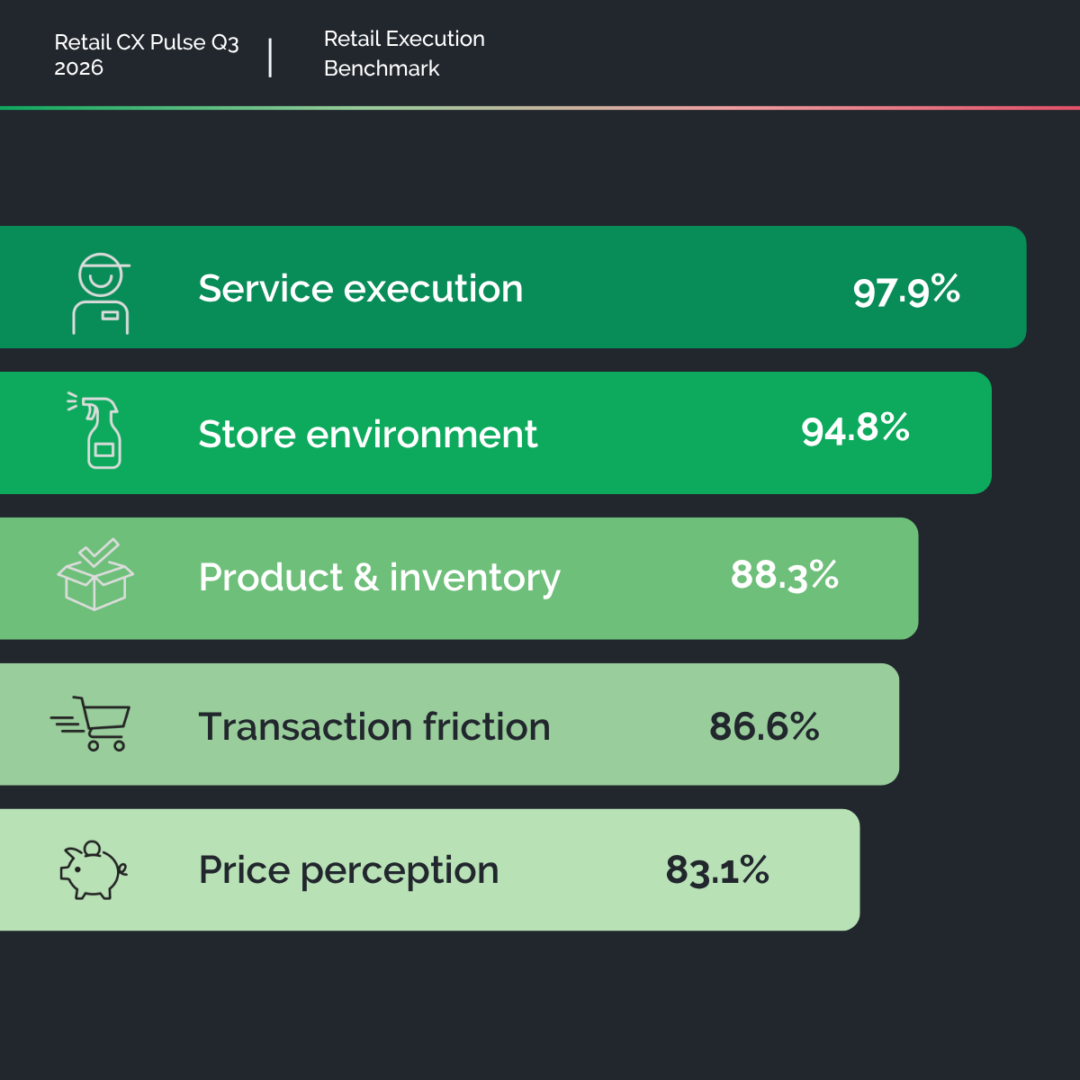
Service execution remains the industry’s strongest operational area at 97.9%, up 0.2 percentage points from Q2. Staff friendliness, availability, customer service, and service speed continue to provide a highly resilient frontline foundation.
Store environment also improved, reaching 94.8%. Cleanliness, accessibility, signage, and the overall physical environment remain important strengths that retailers should protect. The same benchmark also highlights where frontline excellence cannot solve every problem.
Product & inventory fell to 88.3%, down 1.1 percentage points from Q2, the largest decline among the five operational areas. Transaction friction also softened slightly to 86.6%, while price perception fell to 83.1% and remains the lowest-rated area overall.
Customers experience the store as one connected journey. Helpful staff cannot always compensate for an unavailable product, an unclear promotion, or an inconvenient transaction. Strong performance therefore depends on both frontline behaviors and the operational systems behind them.
For retail leaders, the opportunity is twofold: preserve service and environment standards while giving product, inventory, transaction, and pricing issues the attention they need. The next question is whether those standards remain consistent across the trading week.
The Store Execution Pressure Map reveals the challenge of sustaining performance
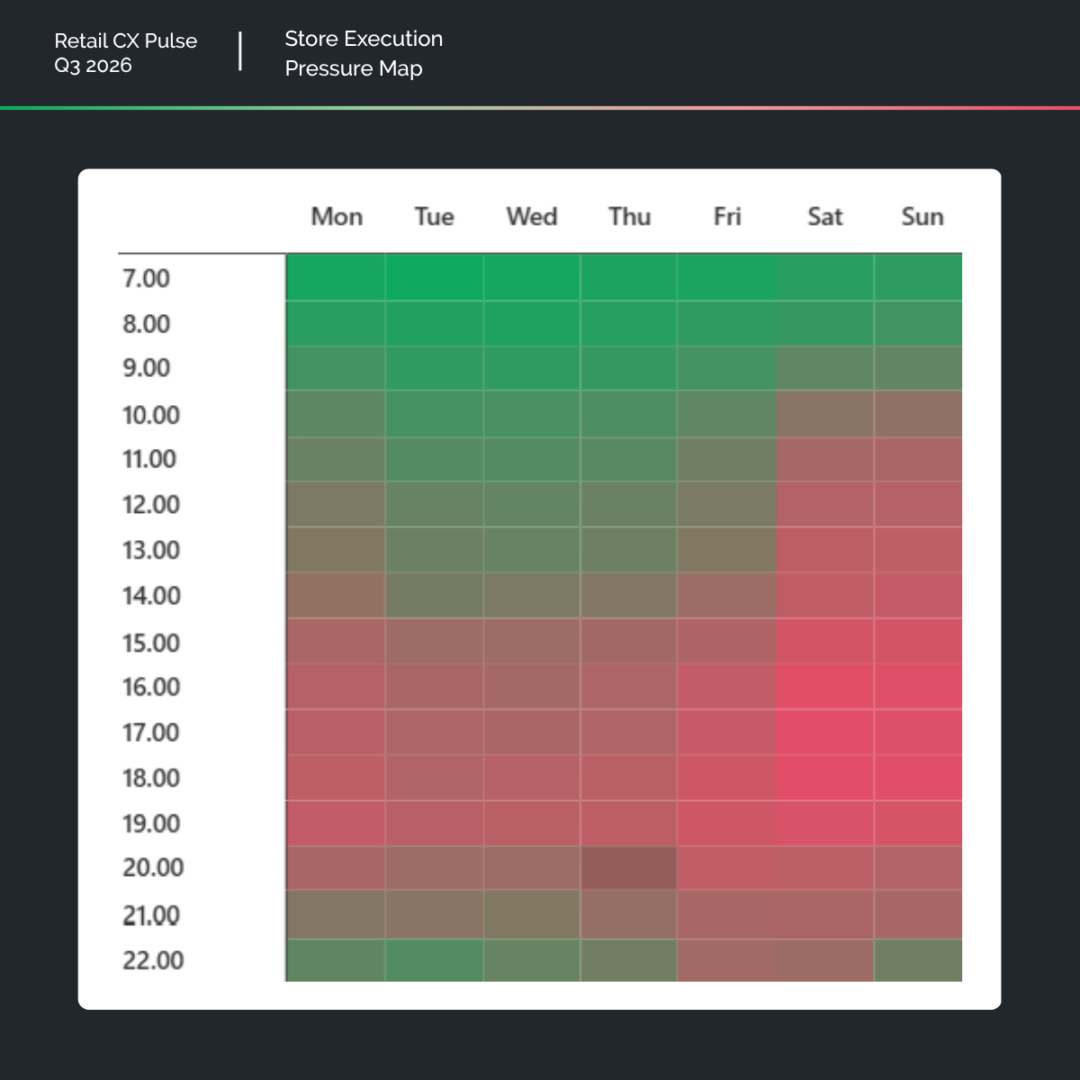
The Q3 Store Execution Pressure Map builds on the established view of customer satisfaction by hour and weekday. It helps retail leaders see when otherwise strong performance becomes harder to maintain.
The patterns are not a diagnosis of individual stores. They identify periods worth investigating alongside local staffing, footfall, replenishment, and checkout information.
Hourly CX peaks at 96.4% at 7:00 before falling through the day, reaching 90.3% at 17:00 and 18:00. Performance recovers somewhat later in the evening, but remains below early-day levels. Across the week, Wednesday performs strongest at 92.8%, while Saturday falls to 90.8% and Sunday to 90.6%.
These patterns do not prove that busy periods cause lower satisfaction. They show when operational conditions may deserve closer attention and where stronger preparation could help. That visibility gives managers a practical starting point for reviewing staffing, floor coverage, replenishment timing, checkout readiness, and leadership support against the realities of the trading week.
The value is not simply knowing when satisfaction changes. It is using that knowledge to ask better operational questions.
Why managing performance requires more than an average score
A quarterly CX score summarizes the outcome. Operational patterns help retailers understand where consistent execution may require different decisions.
For example, the gap between stronger midweek results and weaker weekend results is a reason to compare how resources and routines change, not to assume every location faces the same issue. Retail teams can investigate whether staffing, product availability, promotional clarity, and checkout capacity remain aligned with customer expectations across different trading windows.
Real-time customer feedback becomes most useful when teams turn recurring patterns into clear signals, test possible causes, act, and then assess whether the experience improves.
Three priorities for sustaining strong store performance
Q3 points to three practical areas where retail leaders can protect what works and improve consistency.
- Protect the frontline strengths customers value: Service execution remains the strongest operational area. Keep service standards repeatable through clear routines, frontline coaching, and appropriate staffing and support across shifts.
- Address product and inventory friction: Product & inventory recorded the largest quarter-on-quarter decline. Review availability, selection, and quality feedback alongside replenishment and assortment decisions rather than expecting frontline service to compensate for those gaps.
- Plan for differences across the trading week: Weekend satisfaction trails the midweek peak. Use local feedback patterns to review floor coverage, checkout readiness, replenishment, and leadership visibility during the trading periods that need them most.
Sustaining strong performance requires protecting proven strengths while adapting operations where customer expectations are harder to meet.
How strong store performance is an operational discipline
Retail customer experience is shaped by decisions made across every store and every trading day, from frontline support to stock availability and transaction readiness. The Q3 Retail CX Pulse shows an industry delivering strong overall satisfaction, but also meaningful differences between operational areas and trading periods. Those differences create opportunities to improve consistency without losing sight of existing strengths.
For retail leaders, the priority is to connect real-time customer feedback with the operating rhythm of the store: understand what customers experience, identify meaningful patterns, investigate the causes, and focus action where it can make a difference. Strong performance becomes more valuable when teams know what it takes to sustain it.
Download the Q3 Retail CX Pulse
See what it takes to sustain strong store performance. Download the Q3 Retail CX Pulse to benchmark retail customer experience, explore operational strengths and improvement opportunities, and understand how satisfaction changes throughout the trading week.