What you’ll learn
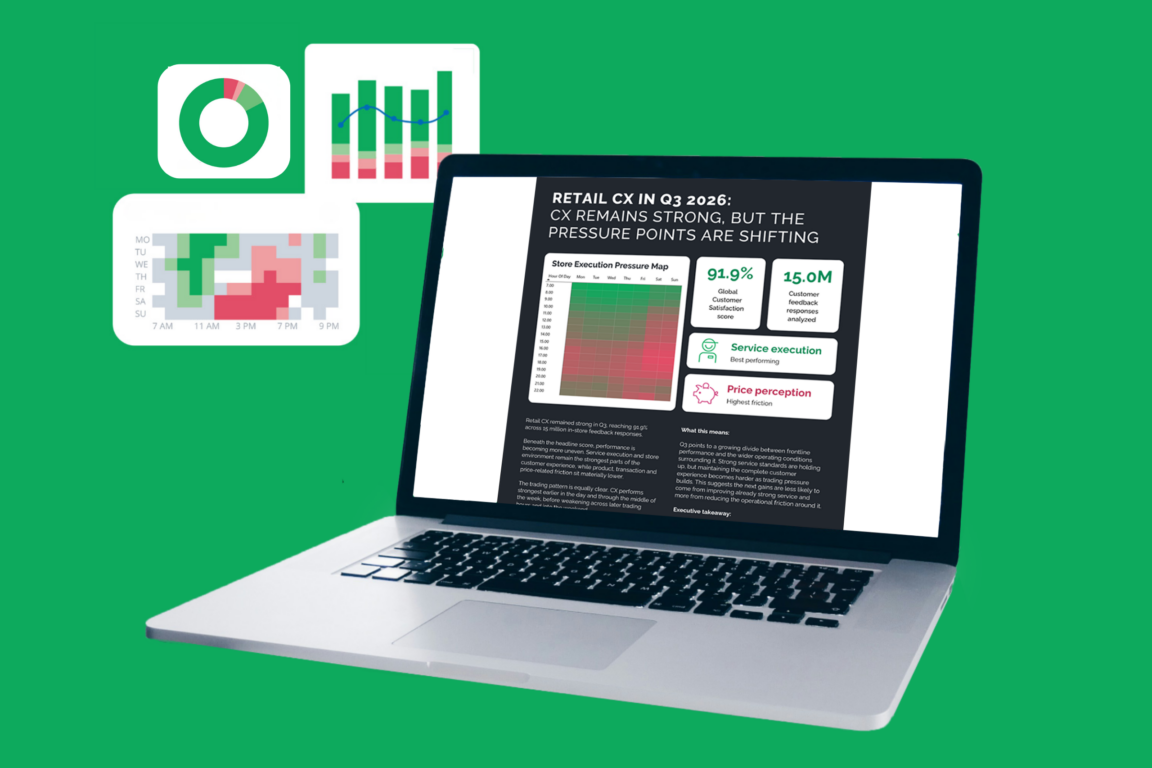
Go beyond the headline CX score to understand the operational factors that help retailers sustain strong store performance. You’ll discover:
- How global retail CX changed from Q2 to Q3
- Which operational strengths to protect and gaps to address
- Where product, inventory and price perception need attention
- How performance varies across hours and trading week
- What to prioritize for more consistent store execution
Understand performance across the trading week
Maintaining strong store performance means knowing when standards are hardest to sustain.
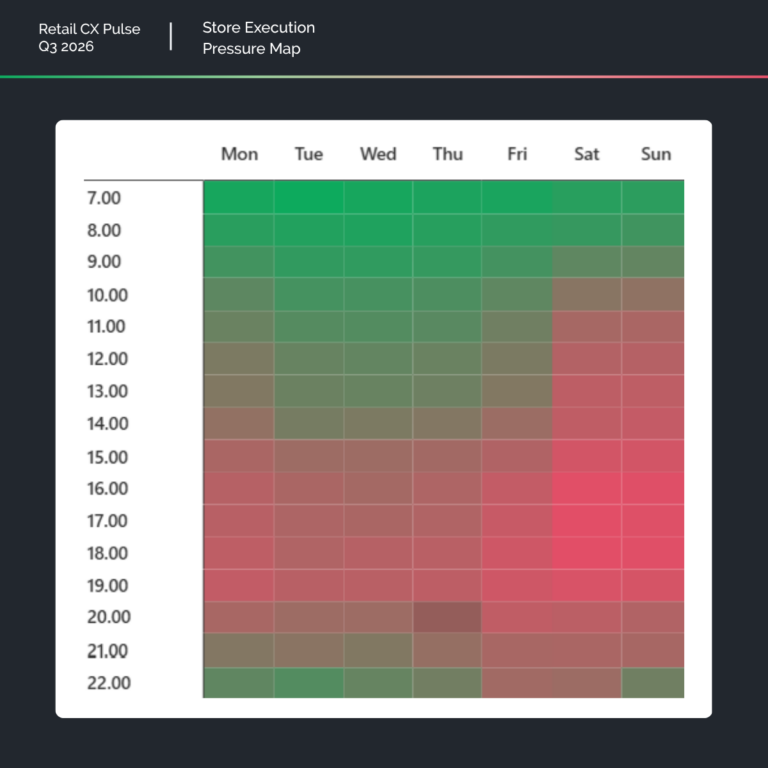
The Store Execution Pressure Map shows how customer satisfaction varies by hour and day, revealing recurring patterns that a quarterly average cannot capture.
Use these patterns to investigate when staffing, floor coverage, replenishment, checkout readiness and management support may need closer attention.
Key insights from Q3
- Global retail CX remained strong at 91.9%, despite a 0.5 percentage-point decline from Q2.
- Service execution (97.9%) and store environment (94.8%) provide strong operational foundations.
- Product & inventory (88.3%) and price perception (83.1%) highlight opportunities to improve.
- Weekend satisfaction trails the midweek peak, showing why trading-week consistency matters.
- Sustaining performance requires protecting strengths and addressing friction across the store operation.
Why it matters
A strong customer satisfaction score is an encouraging benchmark, but sustaining store performance takes more than a high average.
Retail leaders need to understand which operational strengths are holding up, where friction persists and how customer experience changes across trading periods. Those differences can guide more targeted decisions across locations and teams.
The Q3 Retail CX Pulse helps operations leaders benchmark performance, prioritize improvement opportunities and use trading-week patterns to focus attention where it matters.
Trusted by leading retailers worldwide
From global chains to regional retailers, organizations use HappyOrNot real-time customer feedback to identify operational signals and act faster. The Q3 Retail CX Pulse brings together 15 million responses to show the strengths, friction points and trading-week patterns behind retail performance.