How to benchmark dining experience across multiple sites
Benchmarking dining experience means measuring every site the same way, then comparing performance to see what your strongest locations do well. This guide covers the metric to standardize, what to compare and how to turn the gaps you find into steady, portfolio-wide improvement.

To benchmark dining experience across multiple sites, it’s critical to measure the same way at every location and compare performance by site, meal, day and hour. The aim is not to rank sites for its own sake, but to find what your best locations do well and share it with the rest.
For an operator running more than a handful of sites, a single company-wide average tells you very little. It can hide the reality that one dining hall is delighting guests while another, serving the same menu under the same contract, is quietly losing them. Benchmarking replaces that blurred average with a clearer, comparable picture, and it turns your strongest sites into a template others can learn from. This guide covers how to do it well.
Why multi-site operators benchmark
Portfolio dining operations share a particular challenge: performance varies between sites, and the causes are usually local, whether a particular team, a particular kitchen or a particular peak. Without benchmarking, that variation can be hard to see from the top, and a few things tend to slip.
- Struggling sites can go unnoticed. A strong average may mask the one location dragging down the guest experience, often until participation drops or the client raises it.
- Good practice stays local. A strong site has usually worked something out, but without a way to see it, that lesson rarely reaches the others.
- Governance leans on anecdote. Without comparable data, portfolio-level reporting to clients and leadership rests more on impression than on evidence.
The foundation: one consistent measure
Benchmarking works only if every site is measured the same way, at the same moments, on the same scale. If one location runs an occasional survey and another collects comment cards, the numbers are not really comparable. A single, transparent, real-time measure is what makes fair comparison possible.
HappyOrNot’s Happy Index is designed for this. It is a transparent 0 to 100 satisfaction score derived from the same four-button scale everywhere, with no hidden weighting, and it draws on a large cross-industry benchmark base for context. Because it is captured continuously as microfeedback at the point of service, every site produces the same kind of signal, comparable by design.
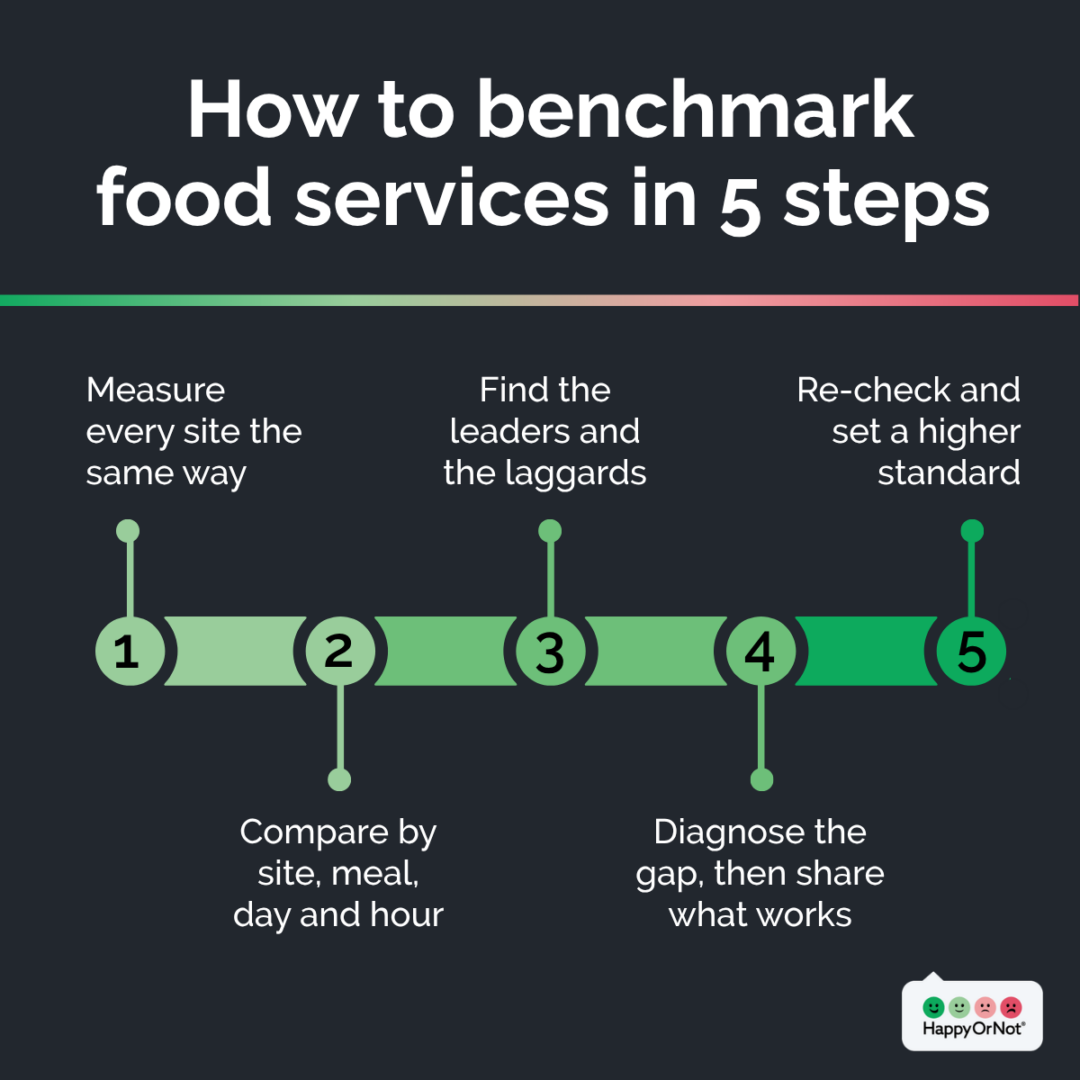
How to benchmark dining experience: a step-by-step method
The following is a practical sequence any multi-site operator can follow. Treat it as a flexible framework rather than a fixed formula, since the right choices depend on your sites and goals.
- Standardize the metric and collection. Use the same feedback tools, such as a Smiley Terminal, Smiley Touch, or Smiley Sign at the same touchpoint (typically the exit or service area) at every site, asking the same question.
- Establish a baseline per site. Let each location build up enough responses to establish its own norm, so you are comparing stable trends rather than noise.
- Compare the dimensions that matter. Look across sites by overall Happy Index, by meal, by day of week and by hour, not just one headline number.
- Find the outliers, both ways. Identify the sites lagging the benchmark and the ones leading it. When several locations score well and one does not, that gap is a useful starting point.
- Diagnose the gap. Use time-and-place data and open comments to understand why a site lags, whether a slow lunch peak, a menu problem, or a service issue. The comparison shows where to look; the cause usually comes from a closer read.
- Share what works. Take the practices from your stronger sites, such as staffing patterns, menu choices or service routines, and help the other sites adopt them.
- Re-benchmark and validate. Check whether the gap has narrowed, then treat the improvement as the new standard across the portfolio.
What to compare across sites
Useful dining benchmarking goes beyond a single ranking. The comparisons that tend to help most are:
- Overall satisfaction by site. The headline read on who is leading and who is lagging.
- Performance by meal and daypart. A site may do well at breakfast and struggle at the lunch rush, which the average hides.
- Day-of-week patterns. Consistency across the week is often where multi-site operations win or lose.
- Response volume by site. So you can judge how much weight to give each comparison, especially at quieter sites.
- Trend, not just snapshot. Which sites are improving and which are slipping; direction matters as much as level.
A single analytics view makes these comparisons quick to run, and integrations with tools like Zapier and Power BI let regional leaders build portfolio dashboards on top of the same data.
The centralized-visibility, decentralized-action model
Many effective multi-site operators run a two-level model. Centralized visibility means regional and portfolio leaders see every site on one consistent measure, spot outliers and govern the whole estate. Decentralized action means each site manager sees their own location’s live data and owns the daily fixes. Benchmarking connects the two: the center identifies where to focus, and the frontline acts. It is the approach Unison Retail Management uses at Chicago O’Hare, comparing locations, brands and shifts across a large group of concessions to direct attention where it is needed.
Chartwells applies the same principle in higher education, comparing satisfaction across university dining locations and helping weaker outlets move toward the standard set by the best.
From benchmarking to portfolio-wide improvement
Benchmarking is not an end in itself; it is what drives steady, portfolio-wide improvement. Each cycle finds a gap, closes it by sharing what works and resets the standard a little higher. Over time, that raises the floor across every site, not just the average. It also produces the comparable, trend-based evidence that supports contract renewals and quarterly business reviews (QBRs). To put the underlying measurement in place first, see our guide on how to measure food experience in a managed dining environment.
Benchmark every site on one consistent measure
HappyOrNot gives multi-site operators one real-time view of the dining experience across the whole portfolio, so teams can spot gaps, share what works and show the result. Explore HappyOrNot Analytics or our food service solutions.