Insights: A clearer way to understand customer feedback
HappyOrNot Insights turns complex customer feedback into clear explanations of performance, helping operational teams understand what changed, what matters and where attention is needed, without starting in a dashboard.

Operational teams rarely have a shortage of customer feedback. The challenge is understanding what all that feedback is telling them quickly enough to make better decisions.
When you are responsible for performance across a store, restaurant, airport terminal or network of locations, there is rarely time to work through multiple charts, filters and time periods to find out what changed. You need to know what deserves your attention and you need to know it quickly.
That is why we created Insights, a new way to understand your HappyOrNot feedback.
From feedback data to clear explanations
Traditional analytics gives teams the tools to explore their data in depth. That remains important, particularly when investigating a specific issue or comparing performance across locations and time periods. But not every question should require analysis. Insights provides a clearer way into your feedback by turning HappyOrNot data into a monthly narrative of operational performance, with contextual explanations of important changes and observations.
Instead of beginning with charts and filters, teams begin with an answer. Insights shows how performance changes from month to month, surfaces important observations and notable shifts, and provides the context needed to understand what deserves attention. When deeper investigation is needed, the underlying analytics is still there to explore.
It is an answers-first approach designed around how busy operational teams actually work.
See what changed and what matters
Imagine satisfaction across a group of locations has declined. Knowing the overall score has fallen is useful, but it immediately creates more questions. Is the decline happening everywhere? Did something change recently? Is there a particular location or experience point driving it? What are customers actually saying?
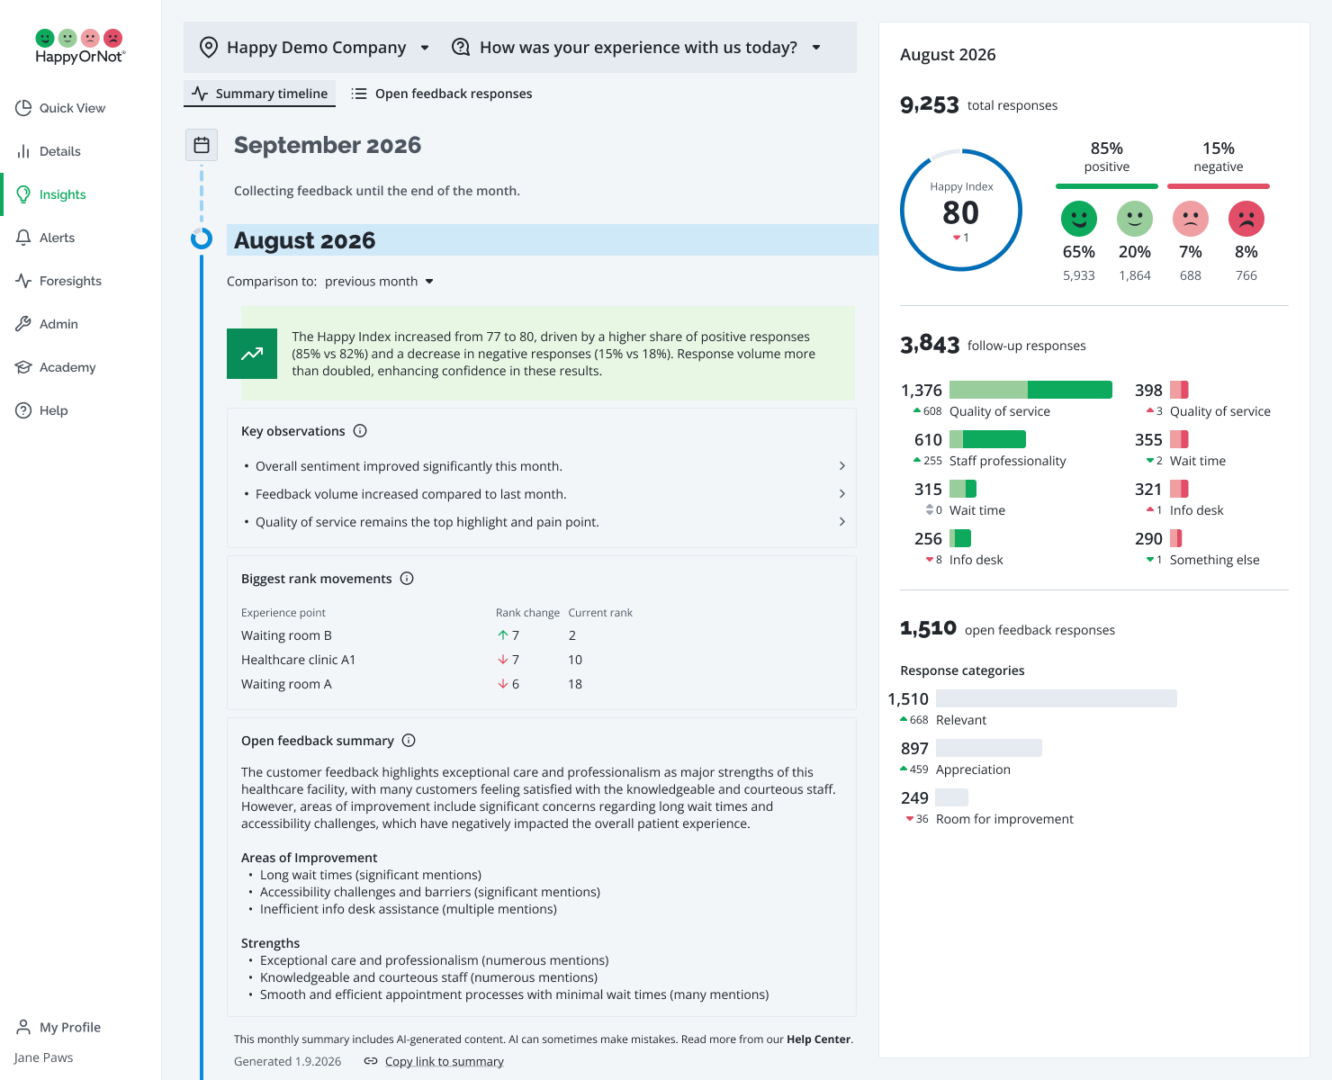
Finding those answers can mean comparing charts, changing filters and reviewing open comments separately, but Insights reduces that effort. AI-generated summaries highlight key observations and changes in performance, while the monthly chronological view makes it easier to understand how results are developing from one month to the next.
Teams can quickly understand what changed, what matters and where their attention may be needed before deciding whether to investigate further.
Bring the numbers and customer comments together
A satisfaction score can tell you that something changed. What customers say can provide valuable context around that change.Insights brings quantitative signals and customer comments together to help explain the monthly performance story, giving teams a more complete picture of operational performance.
That matters because operational decisions rarely come from a single number. A drop in satisfaction at a checkout, for example, becomes more meaningful when recurring customer comments provide additional context around the experience. Rather than looking at each signal in isolation, teams have a clearer starting point for understanding what is happening.
Less time analyzing. More time focused on improvement.
For a regional manager responsible for dozens of locations, or a site manager balancing customers, employees and day-to-day operations, time spent finding the signal is time that cannot be spent improving performance.
Insights is designed to shorten that journey. It reduces repetitive analysis and manual comparison, makes important shifts easier to identify and helps teams develop a more consistent understanding of performance.
The result is simple: less time analyzing feedback and more time deciding what needs attention.
And because deeper analytics remains available when it is needed, Insights does not replace exploration. It gives users a clearer place to start.
Making microfeedback easier to act on
Microfeedback captures the live pulse of an experience. Customers can respond in the moment, generating continuous signals from the places and interactions that matter. But collecting feedback is only part of the equation. Its operational value depends on how quickly teams can understand what those signals mean.
Insights helps close that gap by making the monthly performance story easier for operational teams to understand, and spend less time finding answers and more time improving the experiences behind them.
To learn more about the full suite of HappyOrNot’s AI-powered analytics capabilities, visit our AI Feedback Analytics page.