Happy Index Explained: How Four-Button Feedback Builds Trust
Smiley feedback buttons look simple from the outside, which can lead some people to assume they only capture positive responses, or that the data is “rigged.” The truth is quite the opposite.
Many organizations still fall for common customer feedback myths, such as the belief that only positive responses matter or that customer feedback systems hide negative data.
The Happy Index is built on transparency. It captures every single response, from delighted to dissatisfied, and turns it into data that teams can act on immediately. By combining a clear calculation method with real-time insights, the Happy Index gives organizations a true, unfiltered view of customer sentiment.
HappyOrNot’s mission has always been simple: Help businesses see what is really happening, not just what looks good on paper.
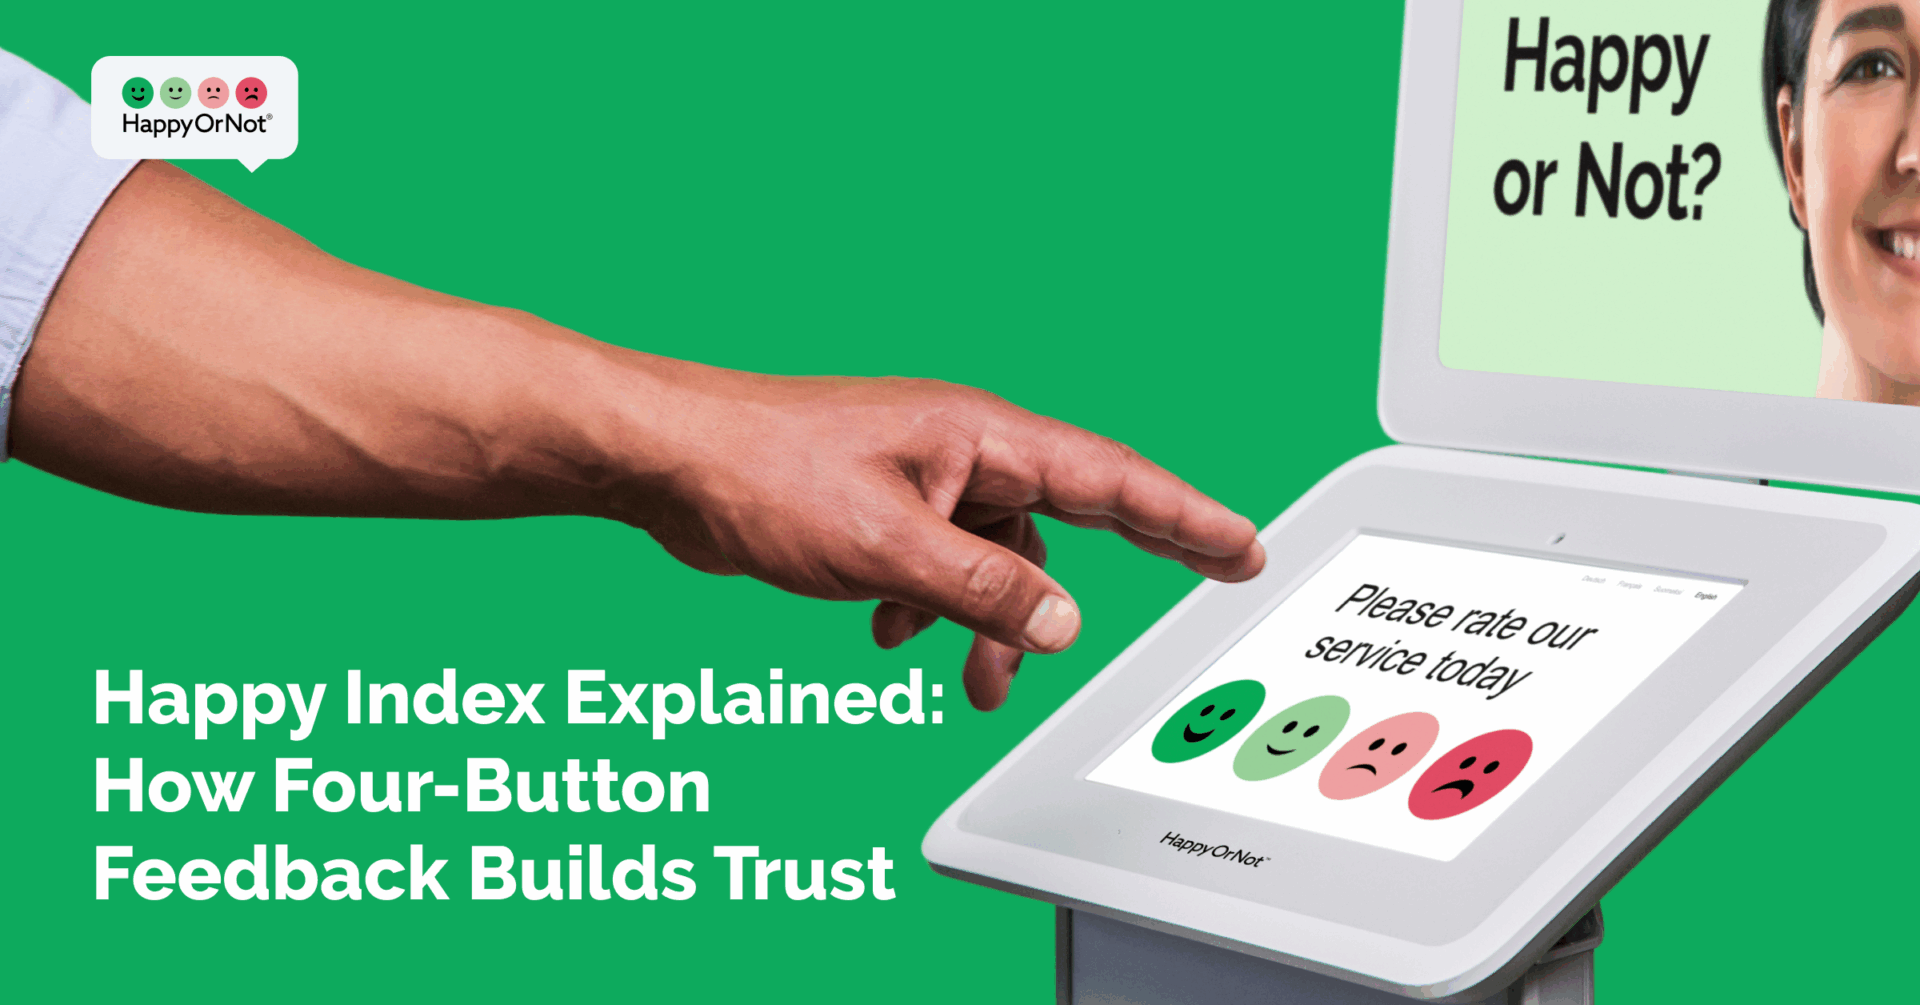
The four-button system: capturing the full spectrum of emotion
At the heart of every HappyOrNot Smileys product is the four-button feedback system, a simple yet powerful way to measure real customer emotions in the moment.
Each Smileys product presents four clear options:
- very happy
- happy
- unhappy
- very unhappy
This design makes feedback fast and intuitive while ensuring every emotion counts. The range captures nuance—satisfaction, frustration, and everything in between—providing richer insights than traditional yes-or-no or five-star surveys can.
Because the system is so simple, response rates stay high, and the data reflects true customer sentiment across thousands of interactions every day.

How the Happy Index is calculated
The Happy Index is completely transparent, with no hidden algorithms or secret weighting. It is the official HappyOrNot performance score, calculated from the arithmetic mean of the smiley responses.
A high score indicates consistent satisfaction, while a sudden drop signals potential service issues that need quick attention. This immediate visibility empowers teams to respond before problems escalate, something long surveys and quarterly reports cannot do.

For a full breakdown of the math behind the score, visit “Happy Index: The Quick Guide.”
Beyond the numbers: seeing what is behind the score
A score alone does not tell the whole story. Context does. HappyOrNot Analytics makes it easy to spot trends, clusters, and performance gaps by visualizing feedback across:
- Time to pinpoint when satisfaction dips (for example, peak hours or shift changes)
- Location to identify specific sites that need attention
- Demographics to reveal unique satisfaction patterns among different customer groups
This real-time customer feedback analysis helps teams interpret not just the score but the story behind it, combining customer sentiment analysis with operational visibility.
Because HappyOrNot Analytics is accessible across teams, everyone—from frontline staff to managers to executives—sees the same information. Transparency builds accountability, and accountability drives trust.
Adding context with open feedback and HappyOrNot AI
While Smiley button data shows how customers feel, open feedback reveals why, and HappyOrNot AI takes analyzing it to the next level.
HappyOrNot’s AI-powered open feedback tools analyze free-text feedback and automatically categorize it into structured themes, such as:
- Service quality and speed
- Staff professionalism and behavior
- Facility cleanliness and comfort
- Product availability and value
- Process or operational efficiency
The AI engine also performs negative feedback analysis, surfacing recurring issues that drive dissatisfaction before they escalate.
AI-generated summaries turn customer comments into actionable insights, highlighting key areas for improvement and emerging patterns that human reviewers might miss.
By combining quantitative feedback (Smiley button data) with qualitative insights (open feedback), organizations gain a complete understanding of the customer experience.
HappyOrNot’s AI-powered open feedback tools transform raw feedback into real understanding, giving context to every smile, frown, and neutral response.
Radical transparency: the foundation of trust
In today’s data-driven world, transparency builds credibility. HappyOrNot’s approach to customer feedback transparency is intentionally open, with no way to hide negative results or filter out less favorable trends.
Every Smiley button press contributes to the Happy Index. Every data point is visible in HappyOrNot Analytics, and every insight is shared across teams. Managers can identify pain points, employees receive recognition for great service, and executives can make informed decisions grounded in real sentiment.
This level of transparency turns data from a vanity metric into a trust-building system that strengthens both culture and customer relationships.
From insight to action: how feedback improves operations
The combination of the Happy Index and open feedback AI helps organizations move from passive measurement to active improvement.
Here is what that looks like in practice:
- A drop in the Happy Index during lunch hours signals the need for additional staffing.
- Repeated very unhappy presses at one experience point highlight a process bottleneck.
- Positive clusters reveal top-performing teams, creating opportunities for recognition and coaching.
This loop of collect, analyze, and act keeps organizations responsive and agile.
By closing the gap between feedback and action, companies build stronger experiences, more engaged teams, and long-term customer loyalty.
Seeing the whole picture of feedback
The Happy Index proves that true feedback systems do not hide negative sentiment. Every Smiley button press counts, creating an honest reflection of customer experience in real time.
By combining Smiley button results with advanced customer sentiment analysis, organizations can measure, understand, and improve experiences with full clarity.
With the addition of AI-powered open feedback tools, that transparency deepens further. Businesses can now understand why customers respond the way they do and take smarter, faster action to improve it.
Together, the Happy Index and open feedback AI form a complete solution for organizations that value openness, accountability, and continuous improvement.
Request a demo today and discover how the HappyOrNot solution can help you uncover hidden pain points and build lasting trust. Explore our Analytics and transparency solutions.
Frequently Asked Questions
How is the Happy Index calculated?
The Happy Index is the official HappyOrNot performance score—an arithmetic mean of the four Smiley buttons. The calculation applies different weight to the very happy, happy, unhappy, and very unhappy selections, and divides the weighted total by the number of responses to give a fair representation of overall satisfaction.
Can negative feedback be hidden in HappyOrNot?
No. The HappyOrNot solution is built for full transparency. All Smiley button responses, including negative ones, are logged and displayed in real time in HappyOrNot Analytics.
Does HappyOrNot only count positive responses?
No. Every Smiley button press counts toward the Happy Index, including unhappy and very unhappy responses. These lower the score and highlight service gaps that need attention.
How does open feedback enhance the Happy Index?
HappyOrNot’s AI-powered open feedback tools analyze and summarize written comments automatically, categorizing them by theme and highlighting recurring issues. They help organizations understand why their Happy Index rises or falls.
What is the math behind four-button feedback devices?
Each of the four Smiley buttons represents a sentiment level from very happy to very unhappy. The Happy Index aggregates this data using a transparent formula that accurately reflects customer sentiment without bias.
How do dashboards expose pain points?
HappyOrNot Analytics allows users to filter results by time, experience point, and demographics. This segmentation uncovers specific operational challenges and helps teams prioritize improvements.