
Take control of your customer experience
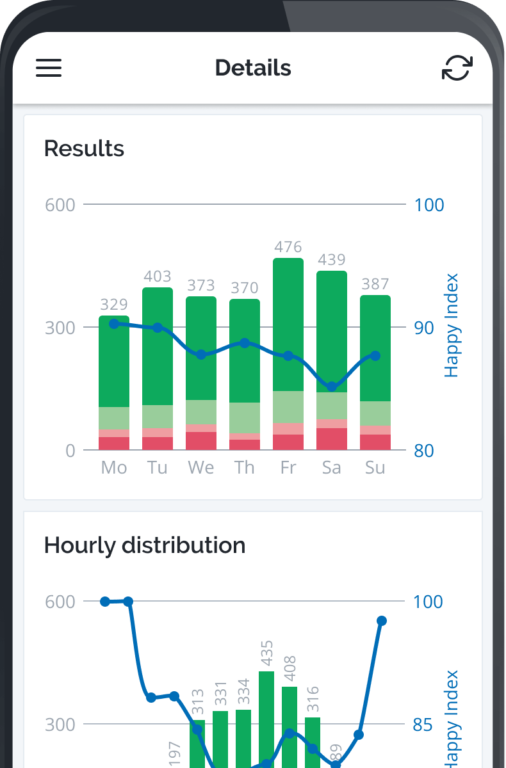
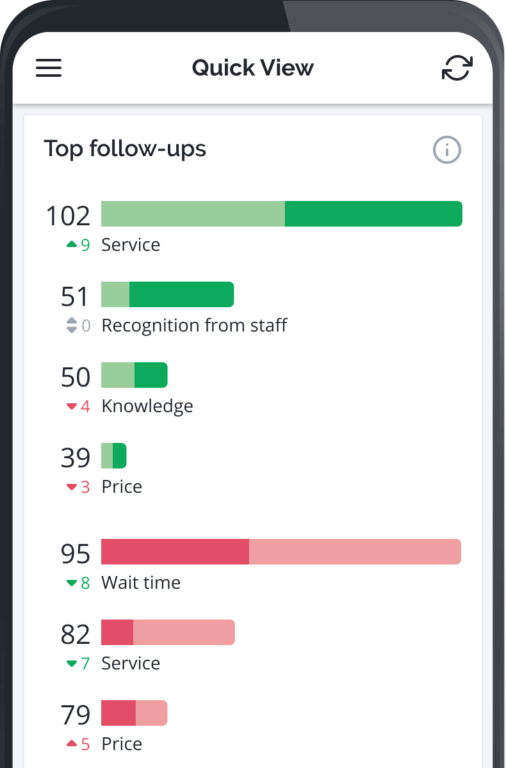
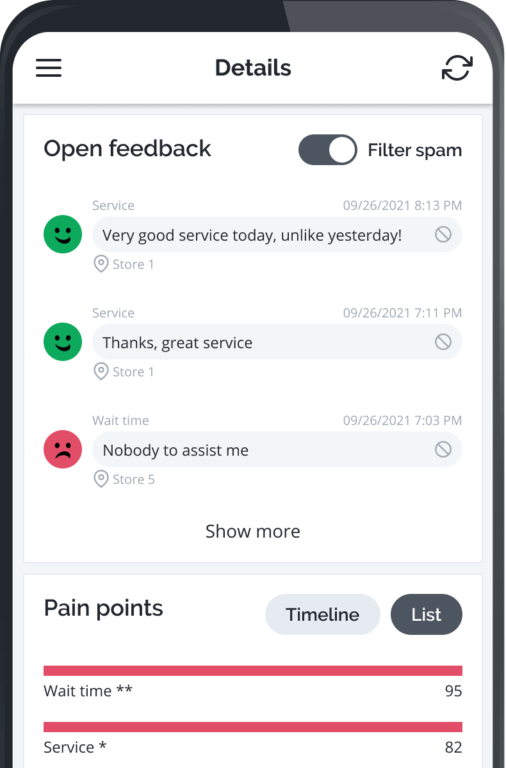
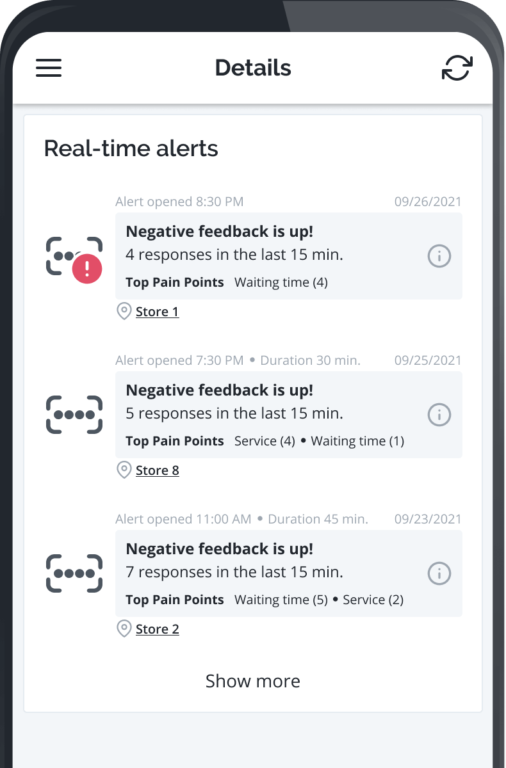
HappyOrNot Analytics is our proprietary software that presents the results of your Smiley feedback in simple charts and graphs. Let Analytics do the hard work for you: mine customer feedback, investigate root causes, and connect the feedback to the defined time and place.
Use the insights to make informed data-driven decisions to improve customer experience, develop operations, and boost your business performance.
Compare
Examine your performance by hour, day, week, month, location, and more.
Analyze
Identify main highlights and pain points in your service as they happen.
Learn
Know your customers and understand why they do, or do not, choose you.
Share
Collaborate in real-time and share results to empower and engage your team.
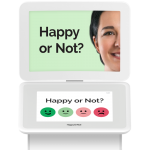
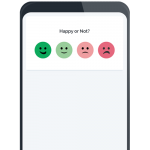
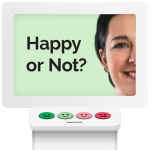
Analytics is the powerhouse behind our Smileys
No matter which Smiley product is right for your business, our Analytics software is always part of the complete solution package. Curious to learn more about our Smileys? Check the links below!
When you want to discover the ‘why’ behind the ‘what’ and ‘when’ of your customer feedback
Get started
HappyOrNot provides customer feedback insights as a service based on subscription. We offer value-based expertise and consultancy to ensure you get the right solution fit for your unique needs. Collect high-volume, relevant feedback and make data-driven decisions!


