How to measure student dining satisfaction on campus
Measuring student dining satisfaction means understanding how students feel about campus dining and reading it often enough to act. This guide covers what shapes satisfaction, the main ways to collect feedback on dining hall food and how to turn what you learn into measured improvement.
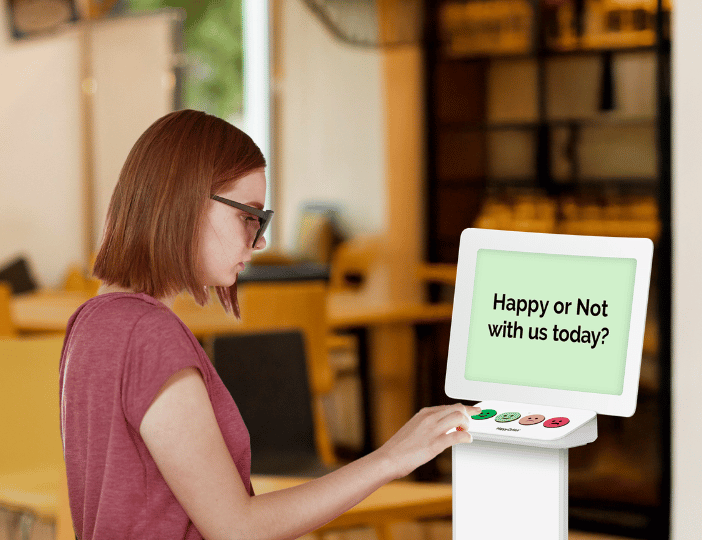
To measure student dining satisfaction, collect short responses from students close to the moment, tie each response to a specific hall, meal and time, and read the resulting feedback alongside participation and other data so teams can identify signals and act on them.
Students are rarely shy about sharing views on campus food, but turning those views into something dining teams can act on takes a structured approach. Annual and periodic surveys provide valuable depth and can inform meaningful operational and strategic changes, although they can arrive too late to address an issue during the current service. Social media comments are candid but not always representative. Real-time feedback adds the immediacy those methods lack, so the strongest programs combine them.
This guide looks at what shapes student dining satisfaction, the main ways to collect student feedback on dining hall food, and how to move from individual responses to measured improvement.
What drives student dining satisfaction
Before choosing a method, it helps to know what students respond to. Every campus is different, so there is no universal list. Our Food Experience framework groups the dining experience into four dimensions that cover much of what shapes a visit:
- FOOD & MENU: quality, choice and availability, including variety across the semester and options for different diets, allergens and cultures. Priorities vary by campus.
- QUEUES & SPEED: waiting time, ordering and payment, including how long the line runs at the lunch and dinner rush and how quickly students can get what they need between classes.
- STAFF & SERVICE: presentation, friendliness and menu knowledge of the dining team.
- ENVIRONMENT: cleanliness, comfort and atmosphere, including seating and noise.
Alongside the experience itself, students also weigh value for money and whether opening hours and locations fit their schedules. Measuring the experience dimensions separately matters, because a single overall score hides which of them is driving a change.
The main ways to collect student feedback
Universities use several methods to hear from students, and the strongest programs combine them. The table sets out the trade-offs.
| Method | Where it helps most | What to keep in mind |
| National Association of College & University Food Services (NACUFS) benchmarking survey | Standardized measures and comparison with peer institutions | A periodic, point-in-time read |
| Periodic student surveys | Depth, the reasons behind trends and strategic planning | Less suited to day-to-day operational visibility |
| Comment cards and digital channels | Specific issues in students’ own words | Volume and who chooses to respond can vary |
| Real-time microfeedback | Frequent responses tied to hall, meal and time | Pair with deeper research to explore causes |
| Social media and reviews | Unprompted, candid views | Harder to act on at the point of service and not always representative |
The NACUFS Customer Satisfaction Benchmarking Survey lets member institutions compare student satisfaction with peer institutions, while real-time microfeedback adds a frequent, operational view. Captured as students leave the service area, short responses tied to a hall, meal and time give dining teams more immediate, time-and-place-specific signals to work with. We cover the peak-period specifics in collecting real-time student feedback during the lunch and dinner rush.
A step-by-step method
Here is a practical sequence any campus dining team can follow. Treat it as a flexible framework rather than a fixed formula:
- Decide what you need to act on. Start from the decisions you want to make, such as which stations to change or when to add staff.
- Choose the touchpoints. Place feedback points where the experience is freshest, such as the exit from the dining hall or a specific station.
- Keep the interaction short. A HappyOrNot flow can include a quick rating, a focused follow-up question and an optional comment. The principle is to keep it easy to complete and ask only what is needed for action.
- Tie every response to time and place. Tag responses by hall, station and hour, so patterns in the feedback can be traced to a specific location and time.
- Review on a cadence. A practical rhythm is daily for issues to address in the next service, weekly for recurring patterns and each term for longer trends.
- Act with named owners and close the loop. Give each issue an owner, show students what changed, and check whether the change improved results.
What to track
A few measures turn raw feedback into something you can manage:
- Overall satisfaction. A single, consistent score to follow over time and compare across halls.
- Satisfaction by hall, station and hour. The breakdown that turns an average into an operational map.
- Follow-up drivers and comment themes. The reasons behind the score, ideally summarized so they are usable.
- Response volume. One indicator of coverage, read alongside consistency of collection, context and who is responding. Volume helps build a stronger evidence base, but on its own it does not make feedback representative.
- Participation. A useful behavioral measure to read alongside satisfaction. It is not a direct measure of satisfaction and can be influenced by many other factors, from price to schedules.
Turning student feedback into action
Feedback earns its keep when it changes the next meal. The teams that improve fastest follow a clear progression:
Responses → Feedback → Signals → Action → Measured performance
Individual student responses come together as feedback. Patterns, differences and themes in that feedback become signals that show where attention is needed, such as satisfaction at one hall dipping at weekday dinner. Teams then act with a named owner and check measured performance afterward to see whether the change worked.
Chartwells Higher Education reviews hourly satisfaction data to see when and where student feedback may be less positive, so staff can make adjustments and check whether they worked. According to its customer story, nearly 100 campuses across the United States use the HappyOrNot solution.
Deeper research still has a role. Use real-time feedback to identify where to look, and a periodic survey or student focus group to explore the causes behind a longer-term pattern.
Key takeaway
Measuring student dining satisfaction is less about running one big survey than about hearing from students often, close to the moment, in a way that ties back to a specific hall and hour. Collect responses where the experience happens, identify the signals in the feedback, track what drives satisfaction rather than just an overall score, and close the loop so students see that their feedback matters. That is what turns measurement into a better dining experience.
Explore how HappyOrNot® helps food service teams capture student feedback at the point of experience and act on it across every hall. You can also read our guide to how to measure food experience in a managed dining environment.