How to calculate NPS® (Net Promoter Score℠)

Net Promoter Score℠ is one of the most widely used customer experience metrics in business – partly because the math is simple, and partly because it gives leadership a single, comparable number to track over time. If you have ever wondered how to calculate NPS®, the formula itself takes about thirty seconds to learn. The harder part is knowing what to do with it.
This guide walks through the NPS formula, what counts as a good score, and how leading teams use it. It also looks at where NPS falls short for day-to-day operations – and how real-time microfeedback fills the gap between quarterly survey results and the decisions frontline managers need to make today.
What is Net Promoter Score (NPS)?
Net Promoter Score is a customer loyalty metric introduced by Fred Reichheld in a 2003 Harvard Business Review article. It measures customer loyalty using a single question: “How likely are you to recommend [company/product] to a friend or colleague?” Respondents answer on a scale from 0 (not at all likely) to 10 (extremely likely).
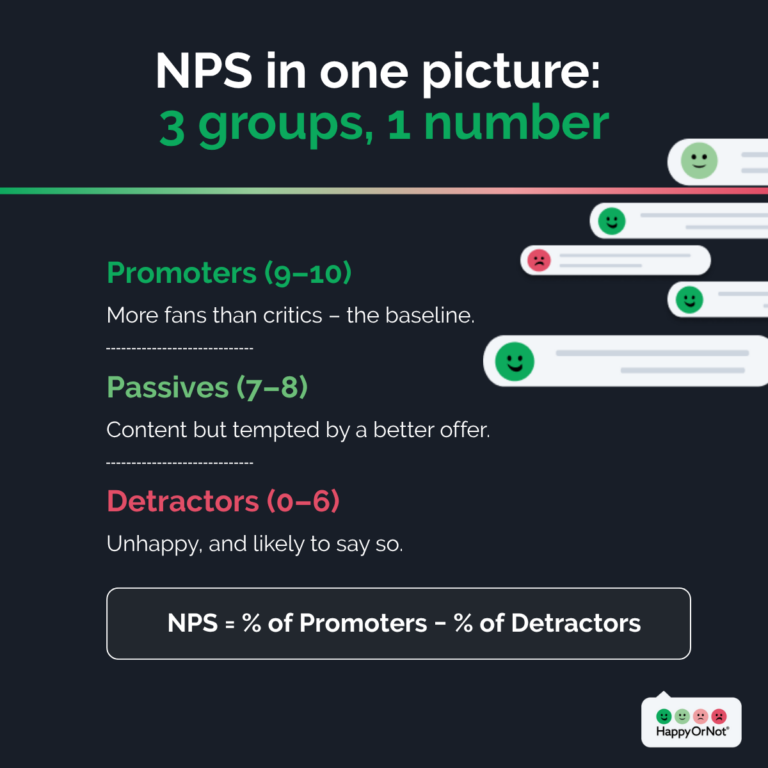
Based on that score, customers fall into three groups:
- Promoters (9–10): Enthusiastic, loyal customers likely to refer others and repurchase.
- Passives (7–8): Satisfied but unenthusiastic – vulnerable to competitive offers.
- Detractors (0–6): Unhappy customers who may damage your brand through negative word of mouth.
The output is a single number between -100 and +100, designed to give leadership a fast, comparable read on customer loyalty across products, regions, and time periods.
How to calculate NPS: the formula and an example
The NPS formula is straightforward:
NPS = % of Promoters − % of Detractors
Passives are not included in the calculation directly – but they still count toward the total when you work out the percentages. Here is the step-by-step:
- Ask the recommendation question to a representative sample of customers.
- Group responses into Promoters (9–10), Passives (7–8), and Detractors (0–6).
- Calculate the percentage of total respondents in each group.
- Subtract the detractor percentage from the promoter percentage. The result is your NPS.
Worked example
Imagine you survey 500 customers after a service interaction and receive the following responses:
- 300 customers scored 9 or 10 → Promoters = 60%
- 125 customers scored 7 or 8 → Passives = 25%
- 75 customers scored 0–6 → Detractors = 15%
NPS = 60% − 15% = 45
Your score is +45. Notice that the passives never appear in the formula directly, but pulling them in or out of the promoter and detractor buckets changes the result. That sensitivity is why NPS responses need to be collected consistently and at meaningful volume.
What is a good NPS Score?
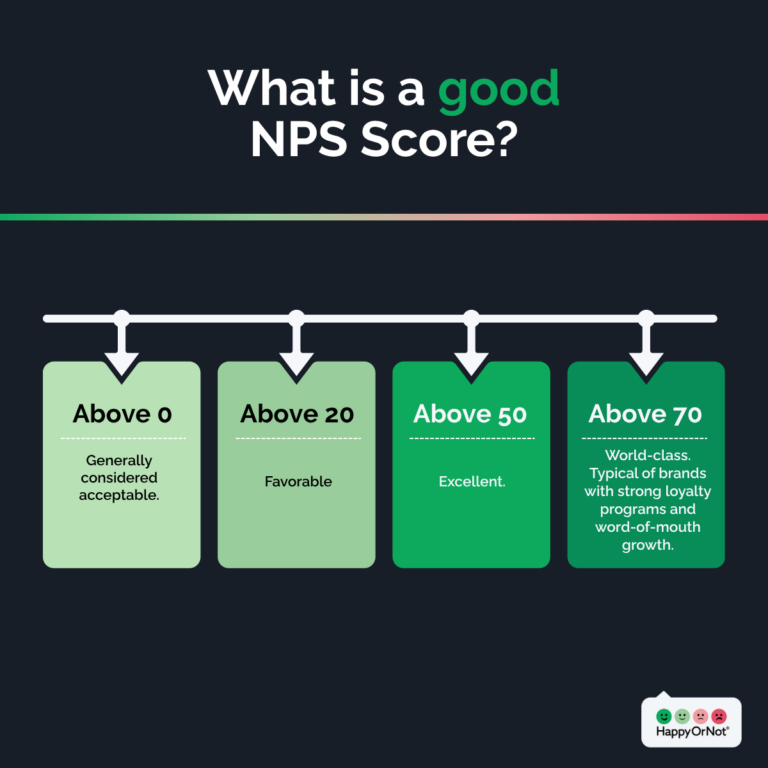
There is no universal benchmark. According to Bain & Company, the firm that co-created the methodology, any positive NPS (above zero) means you have more promoters than detractors. As a rough guide:
- Above 0: Generally considered acceptable.
- Above 20: Favorable.
- Above 50: Excellent.
- Above 70: World-class – typical of brands with strong loyalty programs and word-of-mouth growth.
A more useful comparison is against your industry average. Retail, healthcare, financial services, and SaaS each have very different baselines, so a score of +30 might be excellent in one sector and middling in another. Whatever your benchmark, NPS is most meaningful when tracked over time and segmented by location, product, or touchpoint.
Why businesses use NPS
NPS has stuck around for more than two decades for a reason. It is simple, comparable, and easy to communicate to executives who do not have time for a 25-question dashboard. The most common reasons teams continue to rely on it:
- Benchmarking: A single number that can be tracked over quarters and against industry peers.
- Loyalty measurement: The recommendation question correlates with repeat business and referrals in many industries.
- Trend tracking: Leadership can see at a glance whether the customer base is becoming more or less loyal.
- Cross-functional alignment: Product, marketing, and operations teams can all rally around the same KPI.
NPS works well for strategic reporting. It is harder to use when a store manager opens her inbox on a Monday morning and has to decide what to fix this week.
The limitations of NPS
Even Fred Reichheld himself has acknowledged that NPS, on its own, has gaps. In a follow-up Harvard Business Review piece, “Net Promoter 3.0,” he wrote that self-reported NPS had been gamed and misused enough that it needed to be paired with hard accounting data to remain credible. The most common operational limitations:
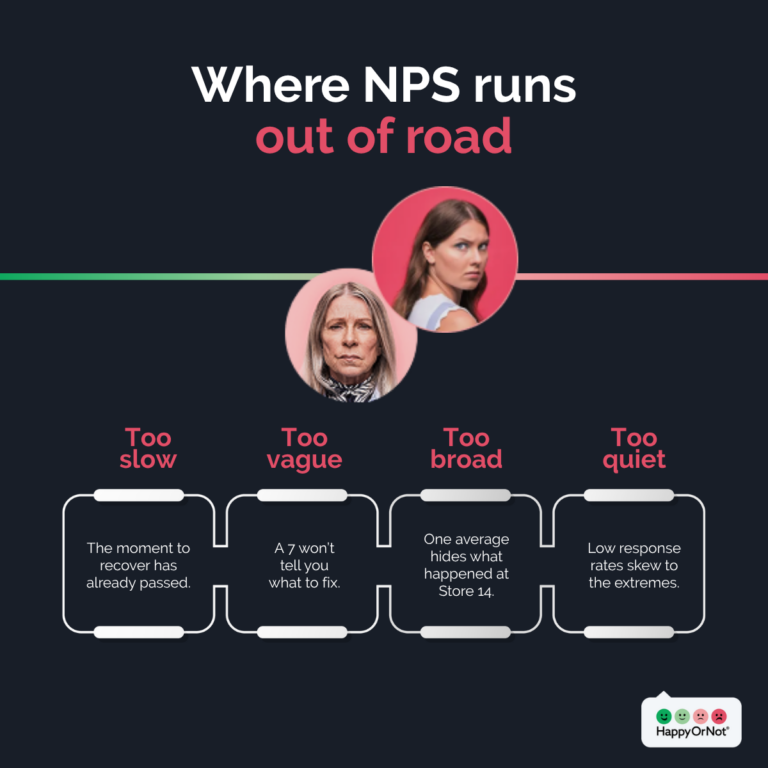
- Delayed feedback. Surveys typically arrive hours or days after the experience. By the time you read a 4/10, the customer is already gone and the moment to recover is past.
- Low context. A score of 7 tells you a customer is a passive. It does not tell you whether your queue was too long, your shelves were empty, or your staff were unfriendly.
- Hard to act on locally. A quarterly enterprise score does not help the manager of Store 14 understand what changed in Aisle 3 last Thursday afternoon.
- Limited frontline usefulness. Frontline teams need fast, location-specific signals – not a single average that bundles weeks of experiences across hundreds of locations.
- Low response rates. Long email surveys generate response rates in the single digits, and the people who respond skew toward extremes – which can distort the score.
None of this means NPS is broken. It means NPS does one job – strategic loyalty tracking – and it does that job well. It was not designed to be the operational signal that tells you what to fix tomorrow morning. For that, you need something faster and closer to the point of experience.
NPS vs real-time customer feedback
The clearest way to think about NPS and real-time customer feedback is that they answer different questions, at different cadences, for different audiences.
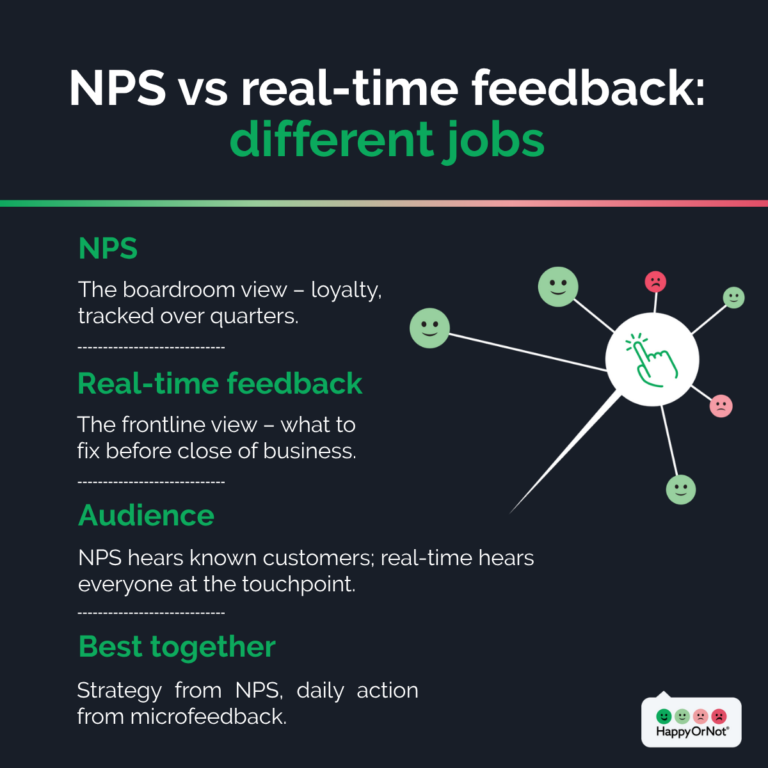
- NPS answers: “How loyal is our customer base overall, and how is that changing over time?” Useful for boardrooms, investor decks, and quarterly business reviews.
- Real-time feedback answers: “What is happening, where, right now – and what should we do about it before close of business?” Useful for store managers, shift leads, and operations directors.
- Who each one hears from: NPS is usually collected from known customers or buyers whose contact details you already have, which makes it a relationship-level metric. Real-time feedback captures a much broader audience at the point of experience – including anonymous visitors, non-buyers, passers-by, and people at specific touchpoints who may never appear in your customer database.
Where NPS leans on a single recommendation question delivered by email, real-time microfeedback captures sentiment in the moment at the point of service – through smiley kiosks, QR or NFC signage, or digital touchpoints. The volume is much higher (often tens of thousands of responses per location per year versus a few hundred surveys), and the context is much richer because each tap is tied to a specific time, location, and follow-up reason.
Surveys versus microfeedback is not an either/or argument. It is a strategic-versus-operational split. PwC research found that 52% of consumers have stopped buying from a brand because of a bad experience, and 29% specifically because of poor customer service – yet 89% of executives still believe customer loyalty has grown in recent years, while only 39% of consumers agree. Closing that perception gap requires both the long view (NPS, CSAT trends) and the daily signal (microfeedback at the point of experience).
How to combine NPS with microfeedback
The most effective customer experience programs use NPS and microfeedback together, with each playing a clear role. A simple framework:
- NPS for the boardroom. Track NPS quarterly or biannually as your strategic loyalty indicator. Pair it with retention and revenue data to give it teeth.
- Microfeedback for the frontline. Use microfeedback from Smiley Touch™ kiosks, Smiley Digital™ touchpoints, and QR or NFC signage to capture real-time signals by location and shift, while issues are still fixable.
- CSAT in between. Add a customer satisfaction pulse at key journey points to bridge the strategic and operational layers.
- One source of truth. Feed all of it into a single analytics layer so leaders and frontline managers see the same data – just at the level of detail each role needs.
Done well, this turns customer feedback from a quarterly debrief into a continuous improvement loop. Quarterly trends tell you whether the strategy is working. Daily microfeedback tells you which store, which queue, and which moment needs attention this week. That is also the philosophy behind HappyOrNot’s feedback management approach: capture signals where service happens, route them to the right owner, and standardize what works.
Key takeaway
NPS remains a valuable strategic metric. It is simple, comparable, and well understood across industries – and tracking it gives leadership a credible read on long-term customer loyalty. But the formula does not, on its own, tell teams what to fix or when. For that, you need real-time microfeedback collected at the point of experience, in volumes high enough to spot patterns by location and time. The strongest programs use both: NPS for the long view, microfeedback for daily action.
—
Net Promoter®, NPS®, NPS Prism®, and the NPS-related emoticons are registered trademarks of Bain & Company, Inc., NICE Systems, Inc., and Fred Reichheld. Net Promoter Score℠ and Net Promoter System℠ are service marks of Bain & Company, Inc., NICE Systems, Inc., and Fred Reichheld.