Airport passenger satisfaction trends: Insights from 24.8 million feedback responses
Analysis of 24.8 million passenger feedback responses reveals how satisfaction changes throughout the airport journey and highlights opportunities for airport operators to improve performance using real-time passenger insights.

Airports today face a difficult balancing act. Passenger expectations continue to rise while operational complexity continues to increase. From fluctuating passenger volumes and staffing pressures to security requirements and weather-related disruptions, airport operators must deliver smooth, efficient journeys in an increasingly challenging environment.
The good news? Passenger satisfaction appears to be moving in the right direction.
To better understand what drives airport satisfaction, HappyOrNot analyzed 24.8 million passenger feedback responses collected across airports in more than 50 countries between May 2025 and May 2026. The findings provide valuable insights into passenger behavior, operational performance, and the airport touchpoints that have the greatest impact on customer satisfaction.
The data also highlights a clear opportunity for airports to improve the passenger experience through real-time feedback, operational visibility, and continuous improvement.
Passenger satisfaction continues to improve
Despite growing operational pressures across the aviation industry, airport satisfaction has steadily increased over the last three years.
Across the key spring travel months of March, April, and May, passenger satisfaction scores have improved consistently year over year.
| Month | 2024 | 2025 | 2026 |
| March | 81.5% | 83.7% | 85.5% |
| April | 81.5% | 83.4% | 85.4% |
| May | 82.1% | 85.1% | 86.0% |
May 2026 recorded the highest satisfaction score of the three-year period, reaching 86.0%.
This trend suggests that many airports are successfully adapting to increasing passenger volumes and operational challenges while continuing to improve the passenger experience.
For airport operators, this is encouraging evidence that investments in operational efficiency, customer service, digital transformation, and passenger experience management are having a measurable impact. This aligns with broader industry trends identified by the Airports Council International (ACI) Airport Service Quality (ASQ) program, which has also reported growing emphasis on customer experience as a key differentiator for airports worldwide.
Passenger support remains the strongest driver of satisfaction
When examining satisfaction across different operational themes, one finding stands out clearly: people matter. Passenger support achieved the highest satisfaction score of all airport experience categories at 87.5%.
This category includes elements such as:
- Staff courtesy and helpfulness
- Service quality
- Passenger assistance
- Customer communication
Access and arrival followed closely behind at 87.3%, while terminal environment achieved an 82.4% satisfaction score.
These results reinforce a trend that consistently appears in passenger feedback data: frontline employees continue to have a significant influence on the overall airport experience.
While technology, infrastructure, and automation play important roles, human interactions remain critical to helping passengers feel informed, supported, and reassured throughout their journey. For example, Heathrow Airport uses real-time passenger feedback to monitor service quality across key touchpoints and empower frontline teams to respond quickly to emerging issues, helping maintain consistently high passenger satisfaction levels.
For airport management teams, investing in employee experience and frontline service capabilities can often deliver significant returns in passenger satisfaction.
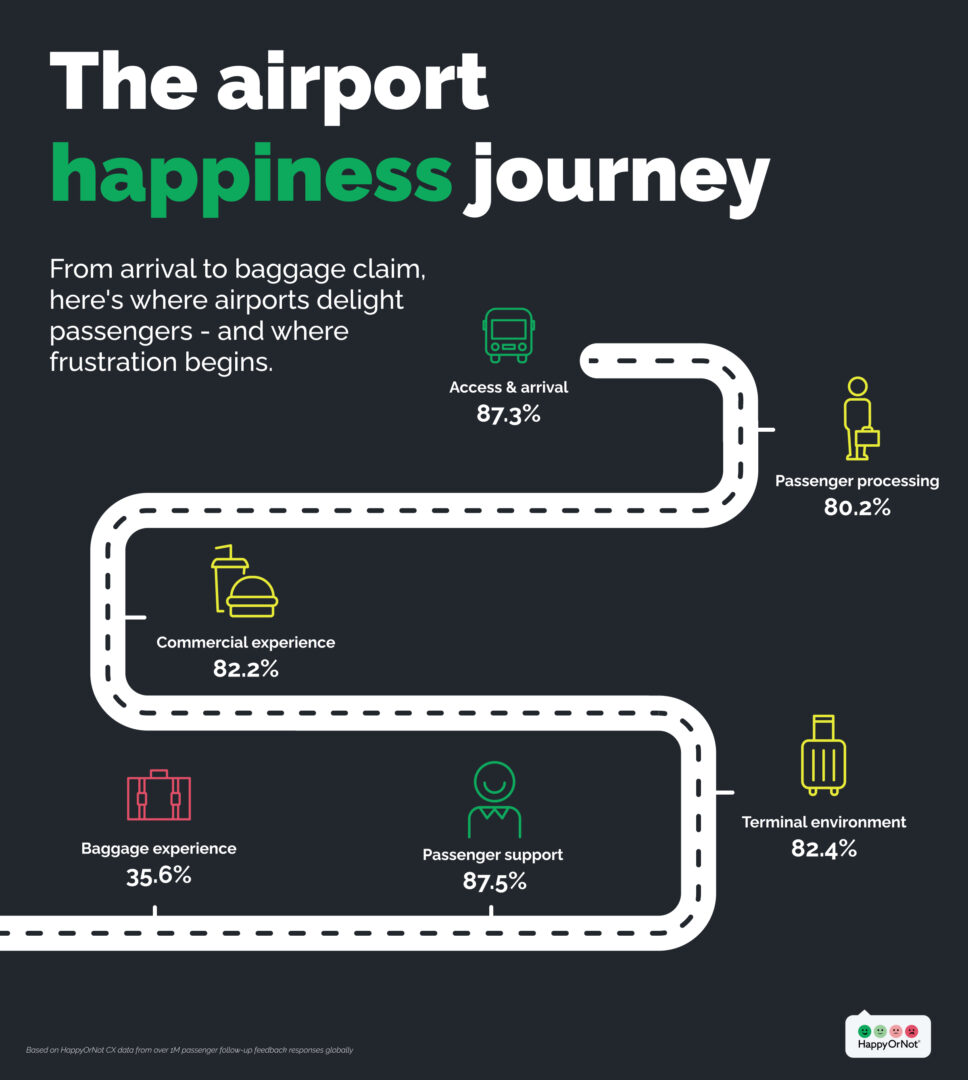
The airport happiness gap: where satisfaction begins to decline
One of the most interesting findings from the data is how passenger sentiment changes throughout the airport journey. Passengers typically begin their journey feeling positive. However, satisfaction gradually declines as they encounter additional friction points.
Access and arrival receives an 87.3% satisfaction score, making it one of the strongest-performing stages of the journey. As passengers move through check-in, security screening, boarding processes, and airport facilities, satisfaction begins to decrease.
Passenger processing, which includes check-in, security, queue management, and boarding, scores 80.2%. Commercial experience, which includes retail, duty free, food, and beverage services, scores 82.2%.
The largest decline occurs at baggage reclaim. Baggage experience receives a satisfaction score of just 35.6%, making it by far the lowest-rated operational theme. This creates what can be described as an “airport happiness gap.”
Passengers start their journey with high levels of satisfaction, but each additional friction point can gradually erode the overall experience. By the time travelers reach baggage reclaim, accumulated delays, waiting times, and operational inefficiencies can have a significant impact on overall satisfaction.
For airport operators, this highlights the importance of understanding the passenger journey as a connected experience rather than a series of isolated touchpoints. Airports such as Dublin Airport and Cork Airport use real-time passenger feedback across multiple stages of the journey to identify friction quickly and coordinate improvements across teams.
Improving a single stage of the journey is valuable, but identifying and removing friction throughout the entire passenger journey often delivers the greatest impact.
How airport operators can prepare for peak travel periods
Passenger satisfaction also varies significantly based on when travelers move through the airport. The data revealed clear differences across both days of the week and times of day.
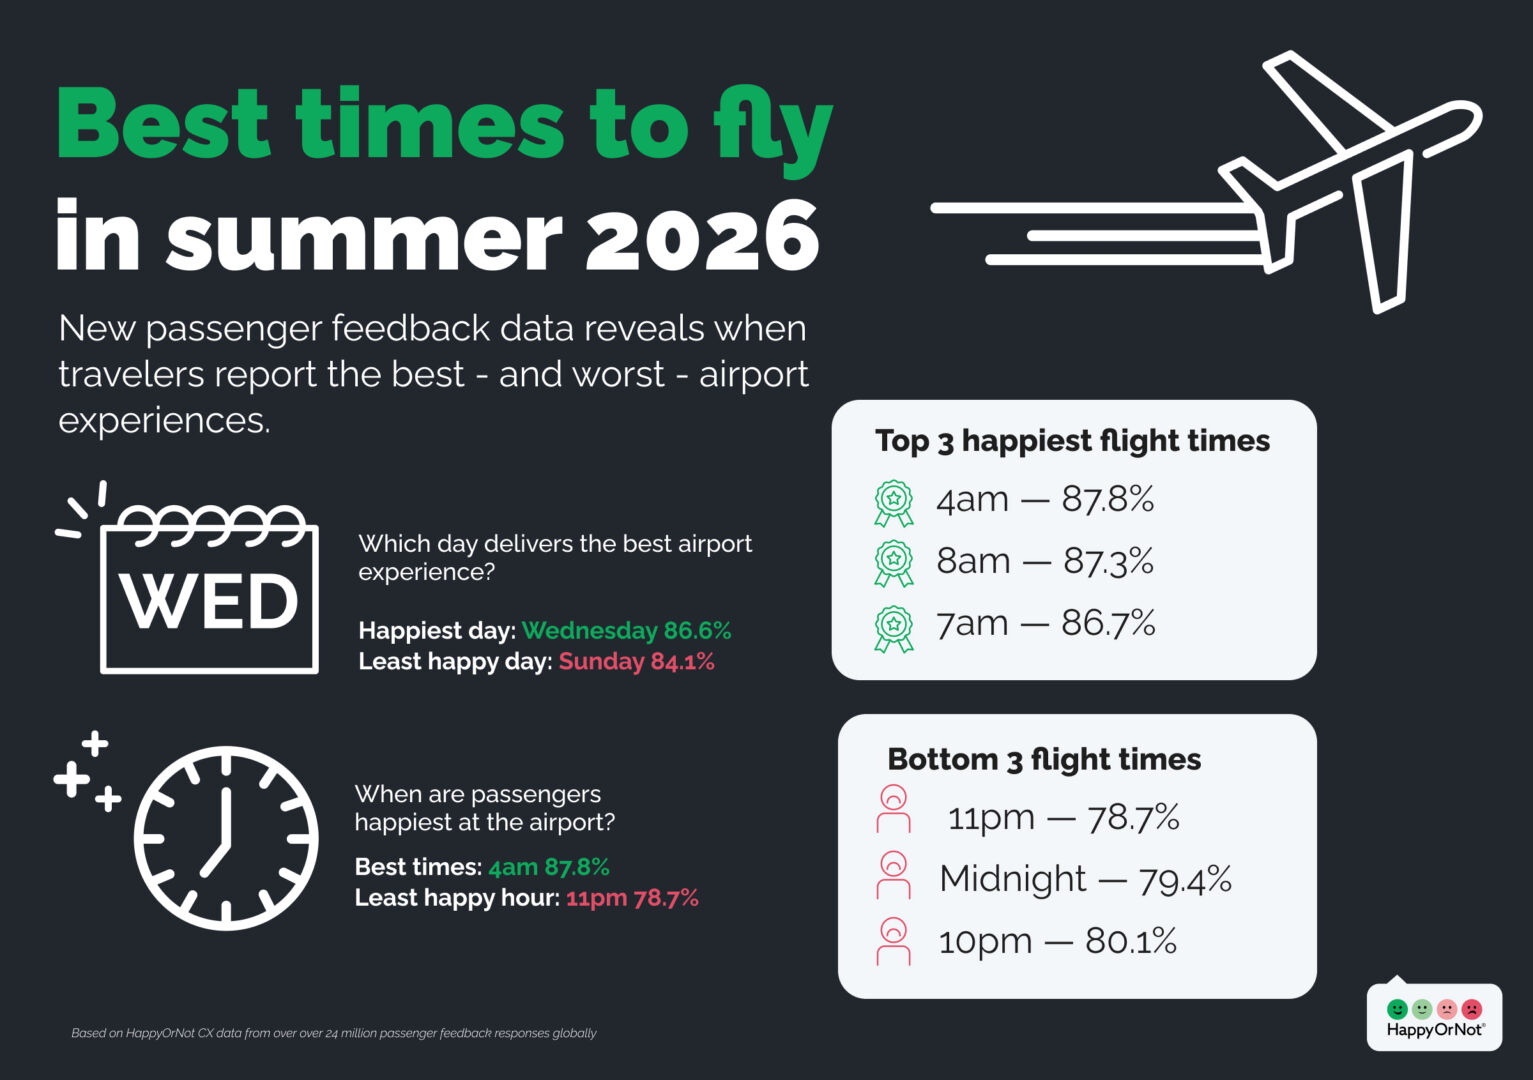
Best and worst days to travel
- Best day: Wednesday (86.6% satisfaction)
- Worst day: Sunday (84.1% satisfaction)
Best times to travel
- 4:00 AM (87.8%)
- 8:00 AM (87.3%)
- 7:00 AM (86.7%)
Lowest-rated times to travel
- 11:00 PM (78.7%)
- 12:00 AM (79.4%)
- 10:00 PM (80.1%)
These patterns likely reflect fluctuations in passenger demand and operational pressure throughout the week.
Midweek travel often benefits from lower passenger volumes, shorter queues, and fewer operational bottlenecks. By contrast, Sundays typically experience increased demand as leisure and business travelers return home before the start of the work week.
Similarly, satisfaction tends to be highest during early morning periods before airports experience peak congestion.
For airport operations teams, these insights demonstrate the importance of aligning staffing levels, resource allocation, and operational planning with changing passenger demand patterns throughout the day. At the world’s largest airport operator, passenger feedback data is used alongside operational metrics to understand how satisfaction fluctuates across locations and time periods, enabling more informed decision-making.
Summer continues to be the most challenging travel season
The data also reveals that summer remains the most demanding period for airport operations. August recorded the lowest monthly satisfaction score during the study period at 82.4%, closely followed by July at 82.5%. Interestingly, both months performed worse than December, which recorded an 83.4% satisfaction score despite holiday travel surges and weather-related disruptions.
The findings suggest that sustained high passenger volumes throughout the summer place considerable pressure on airport operations, including:
- Security screening
- Queue management
- Baggage handling
- Terminal capacity
- Passenger communication
- Food and beverage services
As airports prepare for future peak travel seasons, understanding passenger sentiment in real time becomes increasingly important for identifying emerging issues before they affect large numbers of travelers. According to IATA passenger traffic forecasts, global passenger demand is expected to continue growing, making proactive experience management even more critical during peak periods.
Why real-time passenger feedback matters
Operational metrics tell airport operators what is happening, and passenger feedback helps explain why.
Traditional surveys often provide valuable information, but they are typically collected days or weeks after an experience occurs. By that point, the opportunity to address the issue has already passed. This is where real-time feedback changes that dynamic.
By collecting passenger feedback throughout the airport journey using simple microfeedback solutions, airports can gain immediate visibility into passenger sentiment at specific touchpoints. This enables airport teams to:
- Detect service issues as they emerge
- Identify dissatisfaction before it spreads
- Monitor queue performance and congestion impacts
- Evaluate service quality at individual touchpoints
- Measure the impact of operational improvements
- Prioritize resources more effectively
- Drive continuous improvement using passenger insights
Most importantly, real-time passenger feedback enables airport operators to move from reactive problem solving to proactive experience management.
The value of this approach extends beyond operational areas. At Unison Retail Management, which operates airport retail and dining locations, real-time passenger feedback helps teams identify service issues quickly, improve customer experiences, and support commercial performance.
Turning passenger feedback into operational improvement
Passenger expectations will continue to evolve. At the same time, airports will continue to face operational pressures that are often outside their direct control. The airports that consistently deliver exceptional passenger experiences are not necessarily those with the newest facilities or the largest budgets – they are the airports that listen continuously, identify friction quickly, and use passenger insights to drive operational improvements.
The findings from 24.8 million passenger feedback responses show that while airport satisfaction is improving overall, significant opportunities remain to reduce friction, improve service quality, and enhance the passenger journey.
By combining real-time passenger feedback with operational data, airport management teams can make more informed decisions, prioritize improvements more effectively, and create better experiences for every traveler who passes through their airport.