What is HappyOrNot Demographics and how does it work?
Understanding your customer base is a strategic essential. This is where HappyOrNot Demographics comes to the rescue. It goes beyond data collection, encompassing measurable attributes and spotlighting age and gender.
Age demographics unveil generational insights, while gender demographics provide insights for tailoring products and strategies. This understanding forms the bedrock for businesses to create targeted, personalized approaches, fostering enhanced customer engagement and satisfaction.
What are customer demographics?
Customer demographics encompass specific, measurable attributes of a business’s clientele, primarily focusing on age and gender.
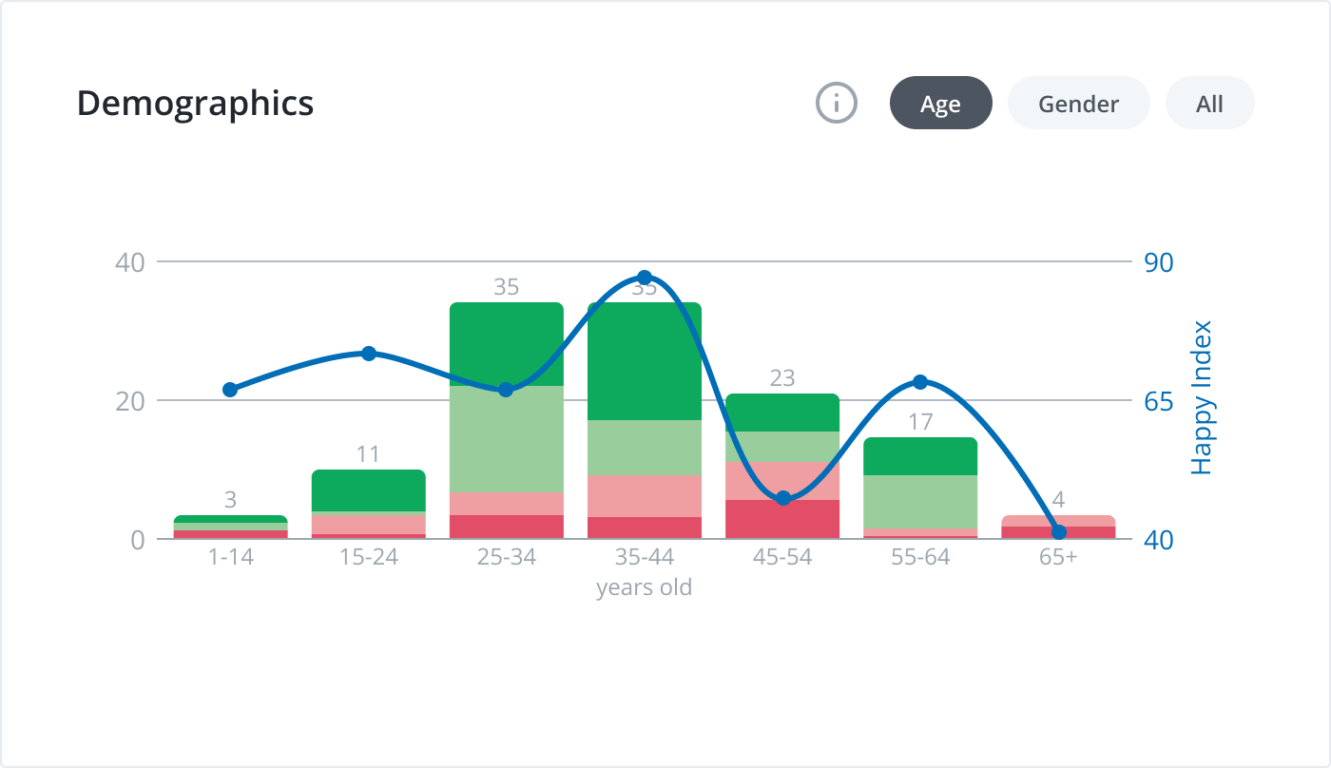
Age demographics categorize customers based on age groupings of 10 years, e.g. 25-34, 35-44, providing insights into preferences and behaviors associated with different age groups.
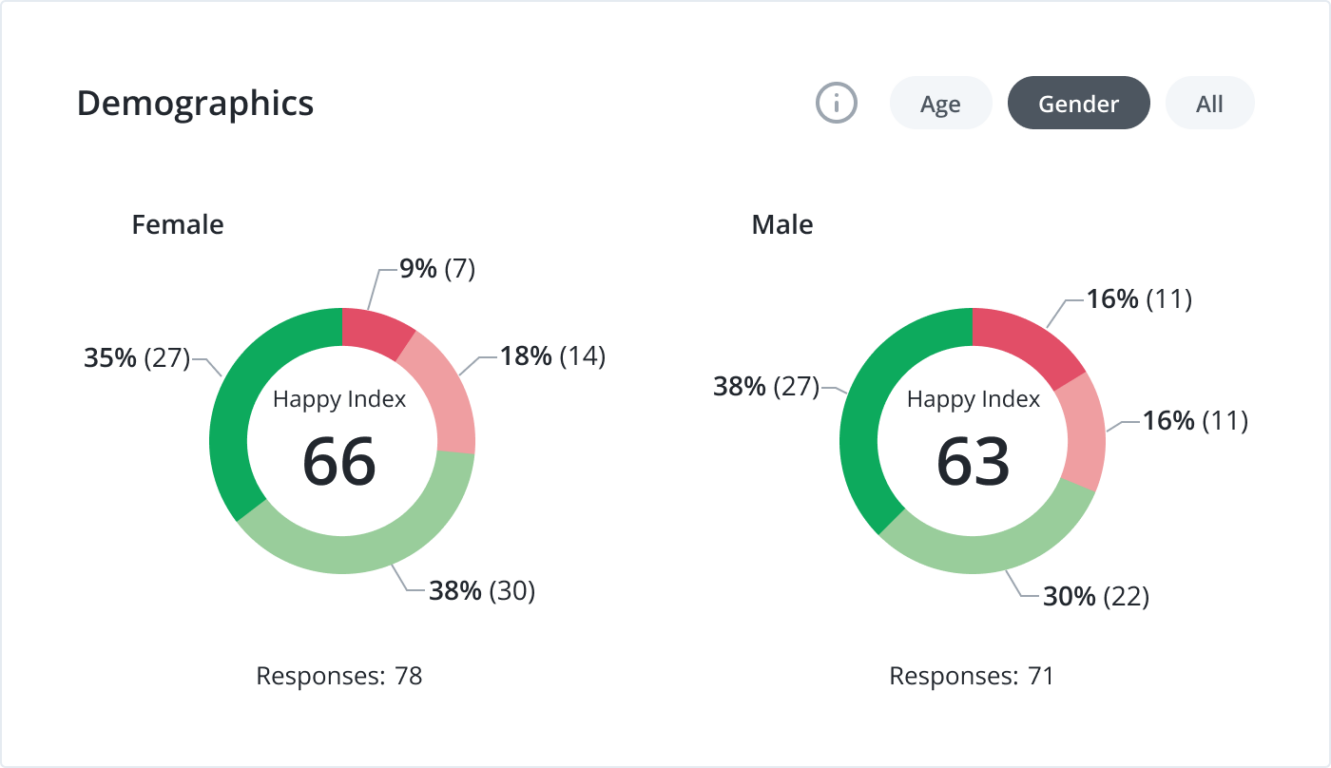
Gender demographics, on the other hand, analyze customer data based on male or female identifiers, aiding businesses in tailoring their products and marketing strategies to diverse gender preferences, and focusing actions to get the biggest impact on overall performance.
This understanding of age and gender demographics allows businesses to create more targeted and personalized approaches, enhancing customer engagement and satisfaction in a nuanced manner that aligns with the unique traits of their audience.
5 benefits of measuring customer demographics
- Targeted marketing strategies
Businesses can tailor their marketing strategies by analyzing customer demographics to resonate specifically with different age groups and genders. This targeted approach ensures that promotional efforts are more relevant and appealing to the diverse segments within the customer base.
- Product and service customization
Demographic data provide insights into various customer segments’ unique preferences and needs. With this information, businesses can customize their products and services to better align with the expectations of specific age groups and genders, fostering greater customer satisfaction and loyalty.
- Improved customer experiences
Knowing the demographics of your customer base allows you to create more personalized and engaging experiences. From communication styles and personal service, to product recommendations or payment options, businesses can fine-tune every touchpoint, enhancing overall customer satisfaction and building stronger connections with their audience.
- Strategic business expansion
Demographic insights are crucial in strategic decision-making, especially when considering expansion or new market entry. Understanding the age and gender dynamics of potential markets helps businesses make informed choices about where to invest resources for maximum impact.
- Effective resource allocation
Measuring customer demographics enables businesses to allocate resources more efficiently. Whether it’s budget allocation for marketing campaigns or staffing decisions for customer service, having a clear understanding of the demographic composition allows for optimized resource distribution, ensuring maximum return on investment.
How does HappyOrNot’s Demographics work
Nestled within the Details section, the Demographics widget provides a comprehensive view of how the performance index fluctuates across diverse age groups and genders. Users can seamlessly view all demographics data in one chart by toggling between various graphs or opt for a more granular analysis by comparing age or gender groups individually.
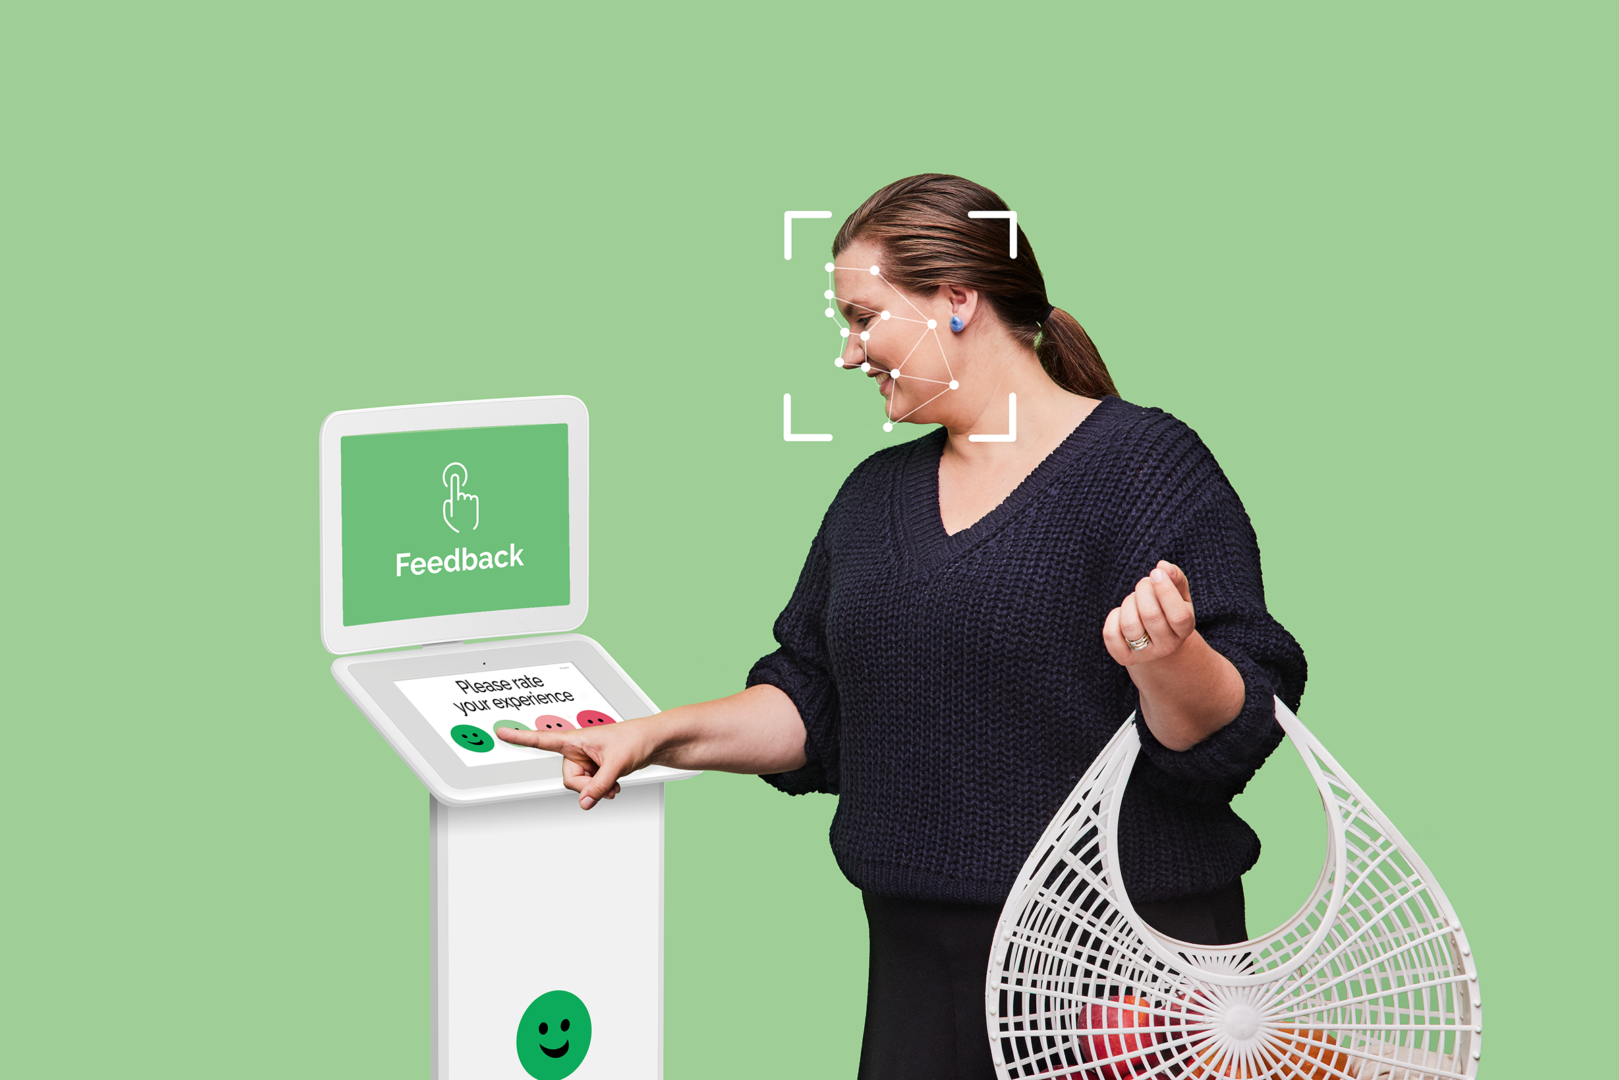
Unlike facial recognition tools, HappyOrNot’s updated Smiley Touch terminal does not identify the individual, instead its only purpose is to analyze a silhouetted vector, which is specifically designed to hide the respondent’s identity.
As a powerful add-on, this tool enables businesses to delve deeper into their customer base, specifically focusing on age groups and genders, identifying the groups that are the happiest or that have the most issues with your service or product. To unleash the potential of this feature, connect with your HappyOrNot contact person, who can guide you through enabling demographics data collection.
Dynamic graphs and informed insights
The content of the graphs is dynamic, adapting to the filters you choose. Whether exploring the holistic view or honing in on specific demographic slices, the Demographics widget molds itself to your analytical needs and preferences.
Support for collaborative success
Downloading the charts as images directly from the widget facilitates effortless sharing with stakeholders and teams or incorporating them into presentations. The power to communicate the nuanced story of your customer satisfaction journey is literally at your fingertips.
Connect feedback data with demographic data
Connecting feedback data with demographic data provides an extra layer of understanding. This feature enriches your analysis by intertwining customer sentiments with demographic profiles, providing insights on what, when, where, why, and who, unlocking unique insights that transcend traditional feedback analysis.
Demographics Academy
To truly master the art of leveraging demographics for customer satisfaction optimization, consider enrolling in the free course offered by the HappyOrNot Academy. Accessible with your HappyOrNot Analytics credentials, it provides a structured learning path to leverage the full potential of the demographics feature and empowers you to extract maximum value from this tool.
Conclusion
With dynamic graphs adapting to your chosen filters, Demographics tailors itself to your analytical preferences. Download the insights, share them effortlessly, and weave the nuanced story of your customer satisfaction journey. The option to connect feedback data with demographic data adds an extra layer, intertwining sentiments with profiles for unique insights.
For those hungry for mastery, the Demographics Academy, a free course by HappyOrNot Academy, provides a structured learning path to unravel the full potential of the Demographics feature, accessible with your HappyOrNot Analytics credentials.
Frequently asked questions
How can the Demographics widget enhance my marketing strategies?
By dissecting age and gender data, the widget enables targeted campaigns, ensuring marketing efforts align precisely with diverse customer segments.
Can I customize my products based on the insights from Demographics ?
Absolutely! Demographic data empowers businesses to tailor products – and services – to the unique preferences and expectations of different age and gender groups.
How does the widget adapt to my specific analytical preferences?
The widget’s dynamic graphs adjust to your chosen filters, offering a personalized experience whether you’re exploring a holistic view or specific demographic slices.
Is there a practical tip for maximizing collaboration using Demographics ?
Download the charts as images directly from the widget to effortlessly share insights with stakeholders, teams, or use them in presentations.
What’s the significance of connecting feedback data with demographic data?
Connecting the two layers enriches analysis, intertwining sentiments with demographic profiles for a deeper understanding and unlocking unique insights that help businesses focus on actions that drive the most immediate improvements or serve the most prominent clienteles.