Customers Left Wanting More this Holiday Shopping Season
Retailers had a busy holiday shopping season again this year, but were they able to maximize sales by exceeding their customers’ expectations in terms of satisfaction with the shopping experience?
Super Saturday and December 23rd were noted as two of the busiest days of the 2016 pre-Christmas shopping season, according to the yearly trend report by ShopperTrak. Before the season approached, HappyOrNot researched its hourly shopper satisfaction data and issued a release to forewarn retailers of the yearly trend of satisfaction decline and offered tips on how to combat dissatisfaction with the intent to improve sales.
So, did retailers listen? How did the 2016 holiday shopping satisfaction trend fare?
We analyzed our data once again to review the hourly shopper satisfaction of these two key days for 2016, a total of over 1.1 million feedbacks, and the outcome is mixed.
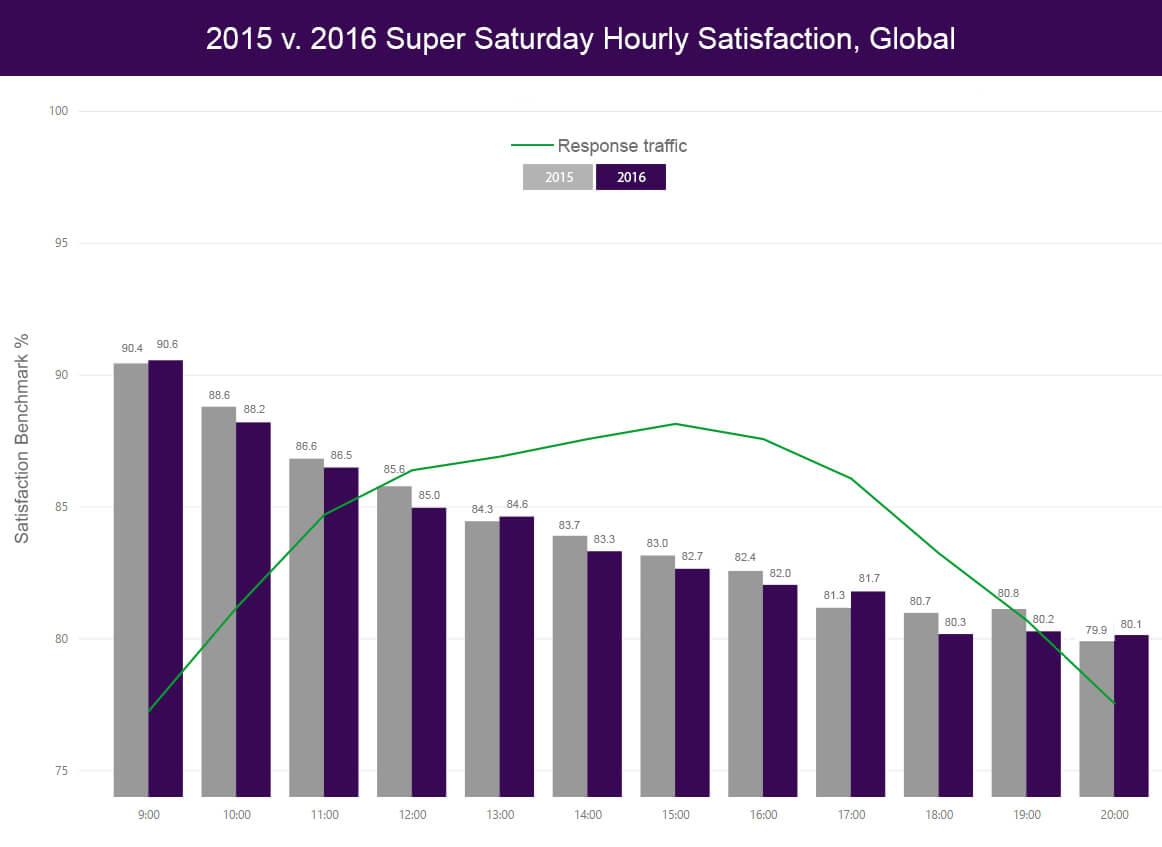
Super Saturday Proved Challenging
As predicted, it unfortunately appears as though this new “overall busiest shopping day” is having trouble catching up with its popularity in terms of shopper experience. Again, this year, shopper satisfaction was on a steady decline every hour between 9am-9pm:
- Average shopper satisfaction benchmark decreased 0.58% from 2015 (84,04%) to 2016 (83.62%)
- Overall hourly decline of 10,5% in 2016, no change from 2015
- Lower satisfaction in 2016 v. 2015 during peak shopping hours (with a small exception at 12pm and 5pm)
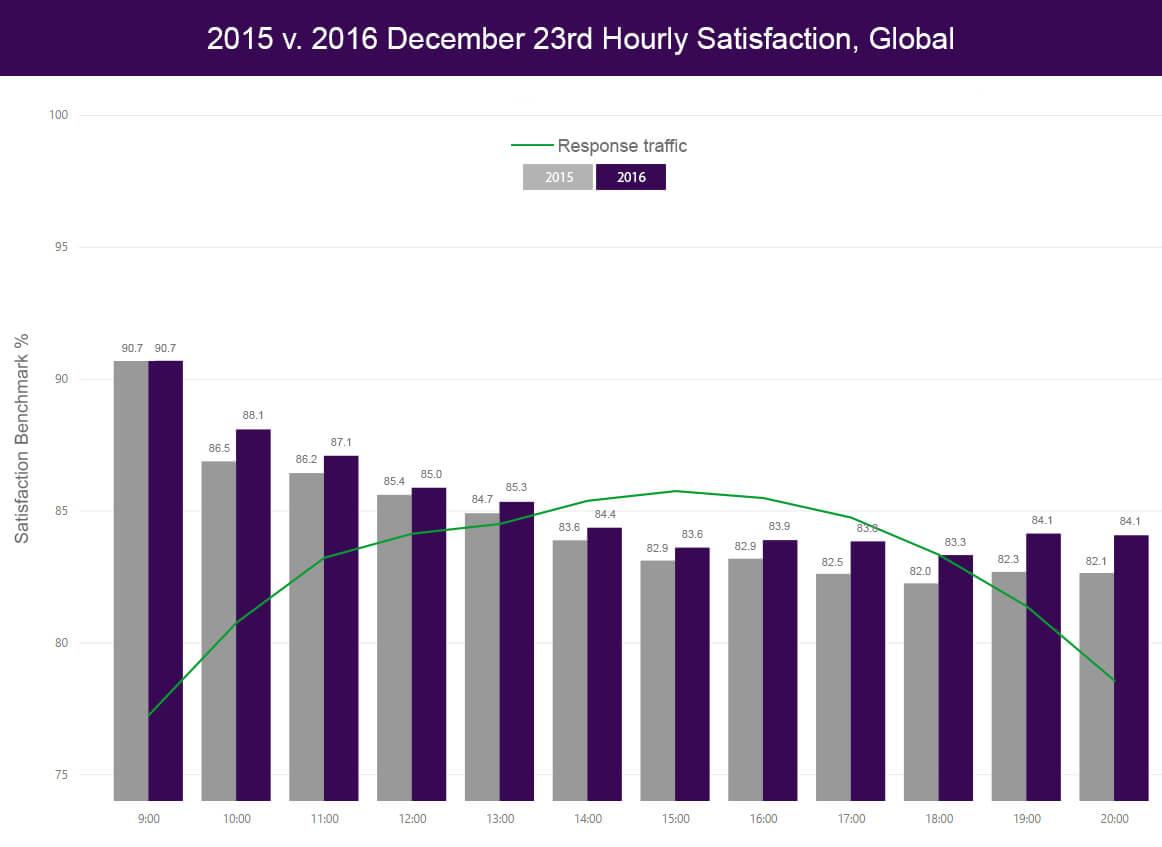
December 23 Noted Small Improvement
Nearly 16% more shoppers venture out on Fridays vs. Wednesdays. And while December 23rd fell on a Friday this year vs. a Wednesday in 2015, the data showed no impact on the experience of shoppers during this busy day. This year’s hourly trend makes a similar sloped curve to 2015, but there were noted improvements, indicating that retailers were more prepared for the rush:
- Average shopper satisfaction benchmark increased 0.85% from 2015 (84,33%) to 2016 (85.18%)
- Overall hourly decline of 6.6% in 2016, a 2% improvement from 2015 (8,6%)
- Improved satisfaction in 2016 v. 2015 during all shopping hours
How to increase sales with happier shoppers
SMG report states that a happy shopper will spend up to 40 percent more during each visit, and, TNS indicates that up to 30 percent of shoppers will walk away from a purchase if they have a bad experience. To improve shopper experiences, HappyOrNot recommends the following:
- Plan adequate work-shifts, especially during the peak traffic hours of 2 – 5pm
- Ensure sufficient product stock is available and easily accessible for shoppers
- Place added focus on staff motivation and support, as positive staff attitudes reflect positively on consumers
About HappyOrNot
HappyOrNot® is the global leader in instant customer and employee satisfaction reporting. Our innovative feedback collecting smileys and intelligent data analytics reporting service help our clients to improve their customer experience, relationships, and employee engagement. We serve over 2,500 companies across 98 countries and have collected and reported on over a quarter billion feedbacks.