A Milestone in CX Analytics
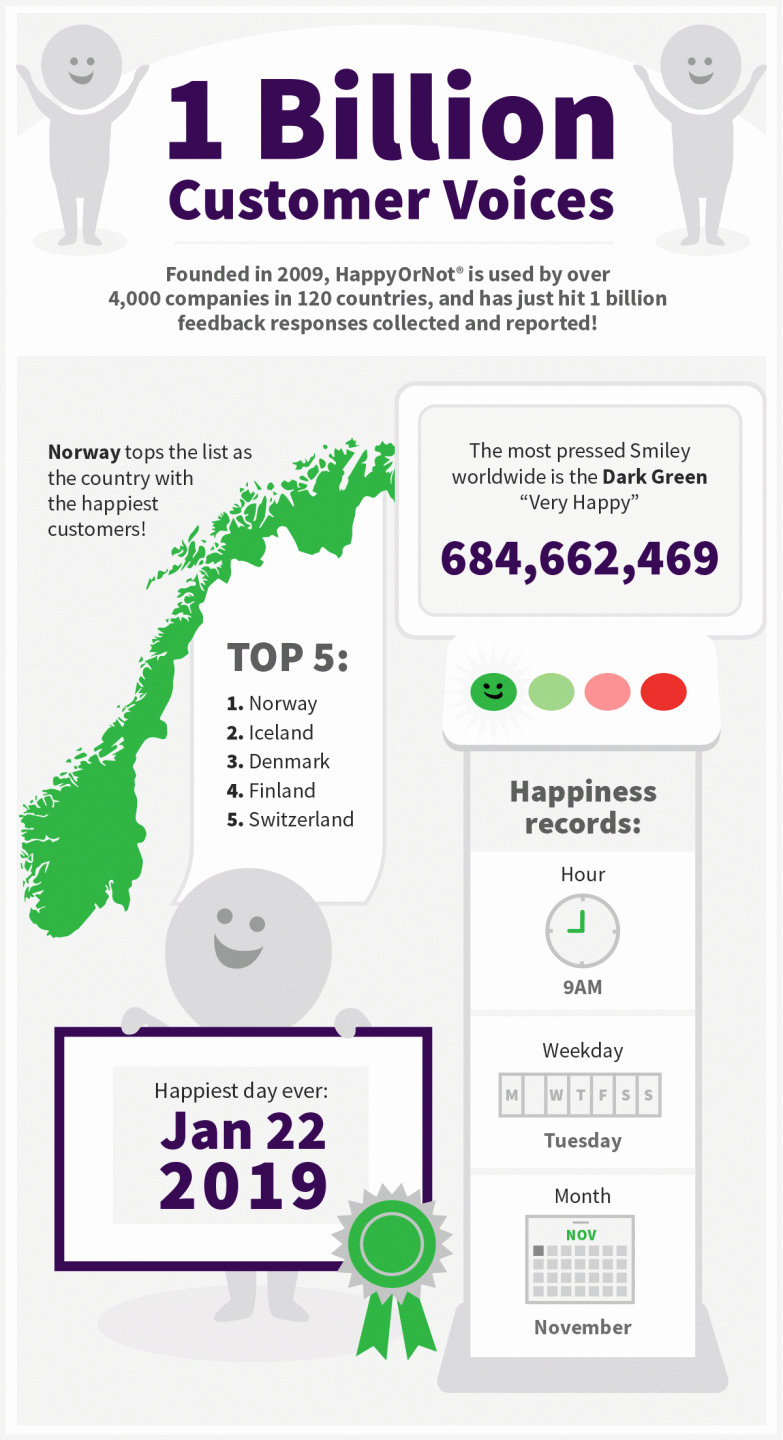
HappyOrNot’s four colored Smiley buttons have now been pressed 1 billion (1,000,000,000) times, by customers all over the world, giving experience feedback to organizations. What does this mean in terms of customer experience in all industries? Keep scrolling to find out!
HappyOrNot Helps Thousands of Companies Achieve Better CX

Very Happy’ Smiley is the Most Pressed
Customers worldwide are most often very happy with the experience they’ve had with a brand. The Happiness Benchmark (total percentage value of green Smileys) of customer experience today is 83.3% from over 684 million voices.
For businesses, the red Smileys numbers show that there is still significant room for improvement. Of all 1 billion customer experience transactions reported, over 167 million of those were bad experiences.

Customer Happiness is Increasing
Year-on-year, worldwide happiness has been overall gradually increasing (despite a small dip to 83.2% in 2017), and is sitting at 85.0% thus far in 2019.
As offering a great customer experience becomes an industry standard of brand excellence, businesses worldwide are coming on board to track and manage their service performance with easy, instant, and actionable CX data insights.
HappyOrNot is proud to be the global leader in customer experience improvement, helping businesses exceed their customer-facing company goals and increasing happiness around the globe year-over-year!
1 Billion Smileys: Key Statistics by Industry

Retail: November is the Happiest Month to Shop
Retail customers worldwide recorded 85.6% satisfaction last year in 2018.
- The happiest month on average to be a retail customer is November (great Black Friday deals). The least happy is August (back to school shopping).
- The happiest day of the week to be a retail customer is Thursday. The least happy is Sunday.
- The happiest hour to be a retail customer is 9am. The least happy is 6pm.
The Black Friday and pre-Christmas sales perhaps unsurprisingly make consumers happy. However, customers would do well to avoid the post-work rush to do their shopping.

Airports: Airports Early Morning Airport Travel is Best
Airport customers worldwide recorded 79.2% traveler satisfaction in 2018.
- The happiest month on average to be an airport customer is November (off-season). The least happy is July (peak season).
- The happiest day of the week to be a airport customer is Wednesday. The least happy is Saturday.
- The happiest hour to be a airport customer is 7am. The least happy is 11pm.
Unsurprisingly, the crowded airports of peak season and busy weekends rank lowest in passenger satisfaction.

Healthcare: Don’t Get Sick on Weekends
Healthcare customers worldwide recorded 87.4% patient satisfaction in 2018.
- The happiest month on average to be a healthcare customer is October (lower bookings). The least happy is August (higher number of bookings).
- The happiest day of the week to be a healthcare customer is Thursday. The least happy is Sunday.
- The happiest hour to be a healthcare customer is 8am. The least happy is 6pm.
The data shows that patients rate the satisfaction with their healthcare providers lowest on weekends, with possible causes like less on-staff doctors and longer waiting times.

Services: A Good Time for Customer Services
Services customers worldwide recorded 83.8% customer satisfaction in 2018.
- The happiest month on average to be a services customer is June (happy start into summer and vacation months). The least happy is December (the hectic Christmas period!).
- The happiest day of the week to be a services customer is Tuesday. The least happy is Saturday.
- The happiest hour to be a services customer is 7am. The least happy is 5pm.
Being a services customer in summer, with more time and better weather, is a much better experience than the busy Holiday season – especially on weekends.
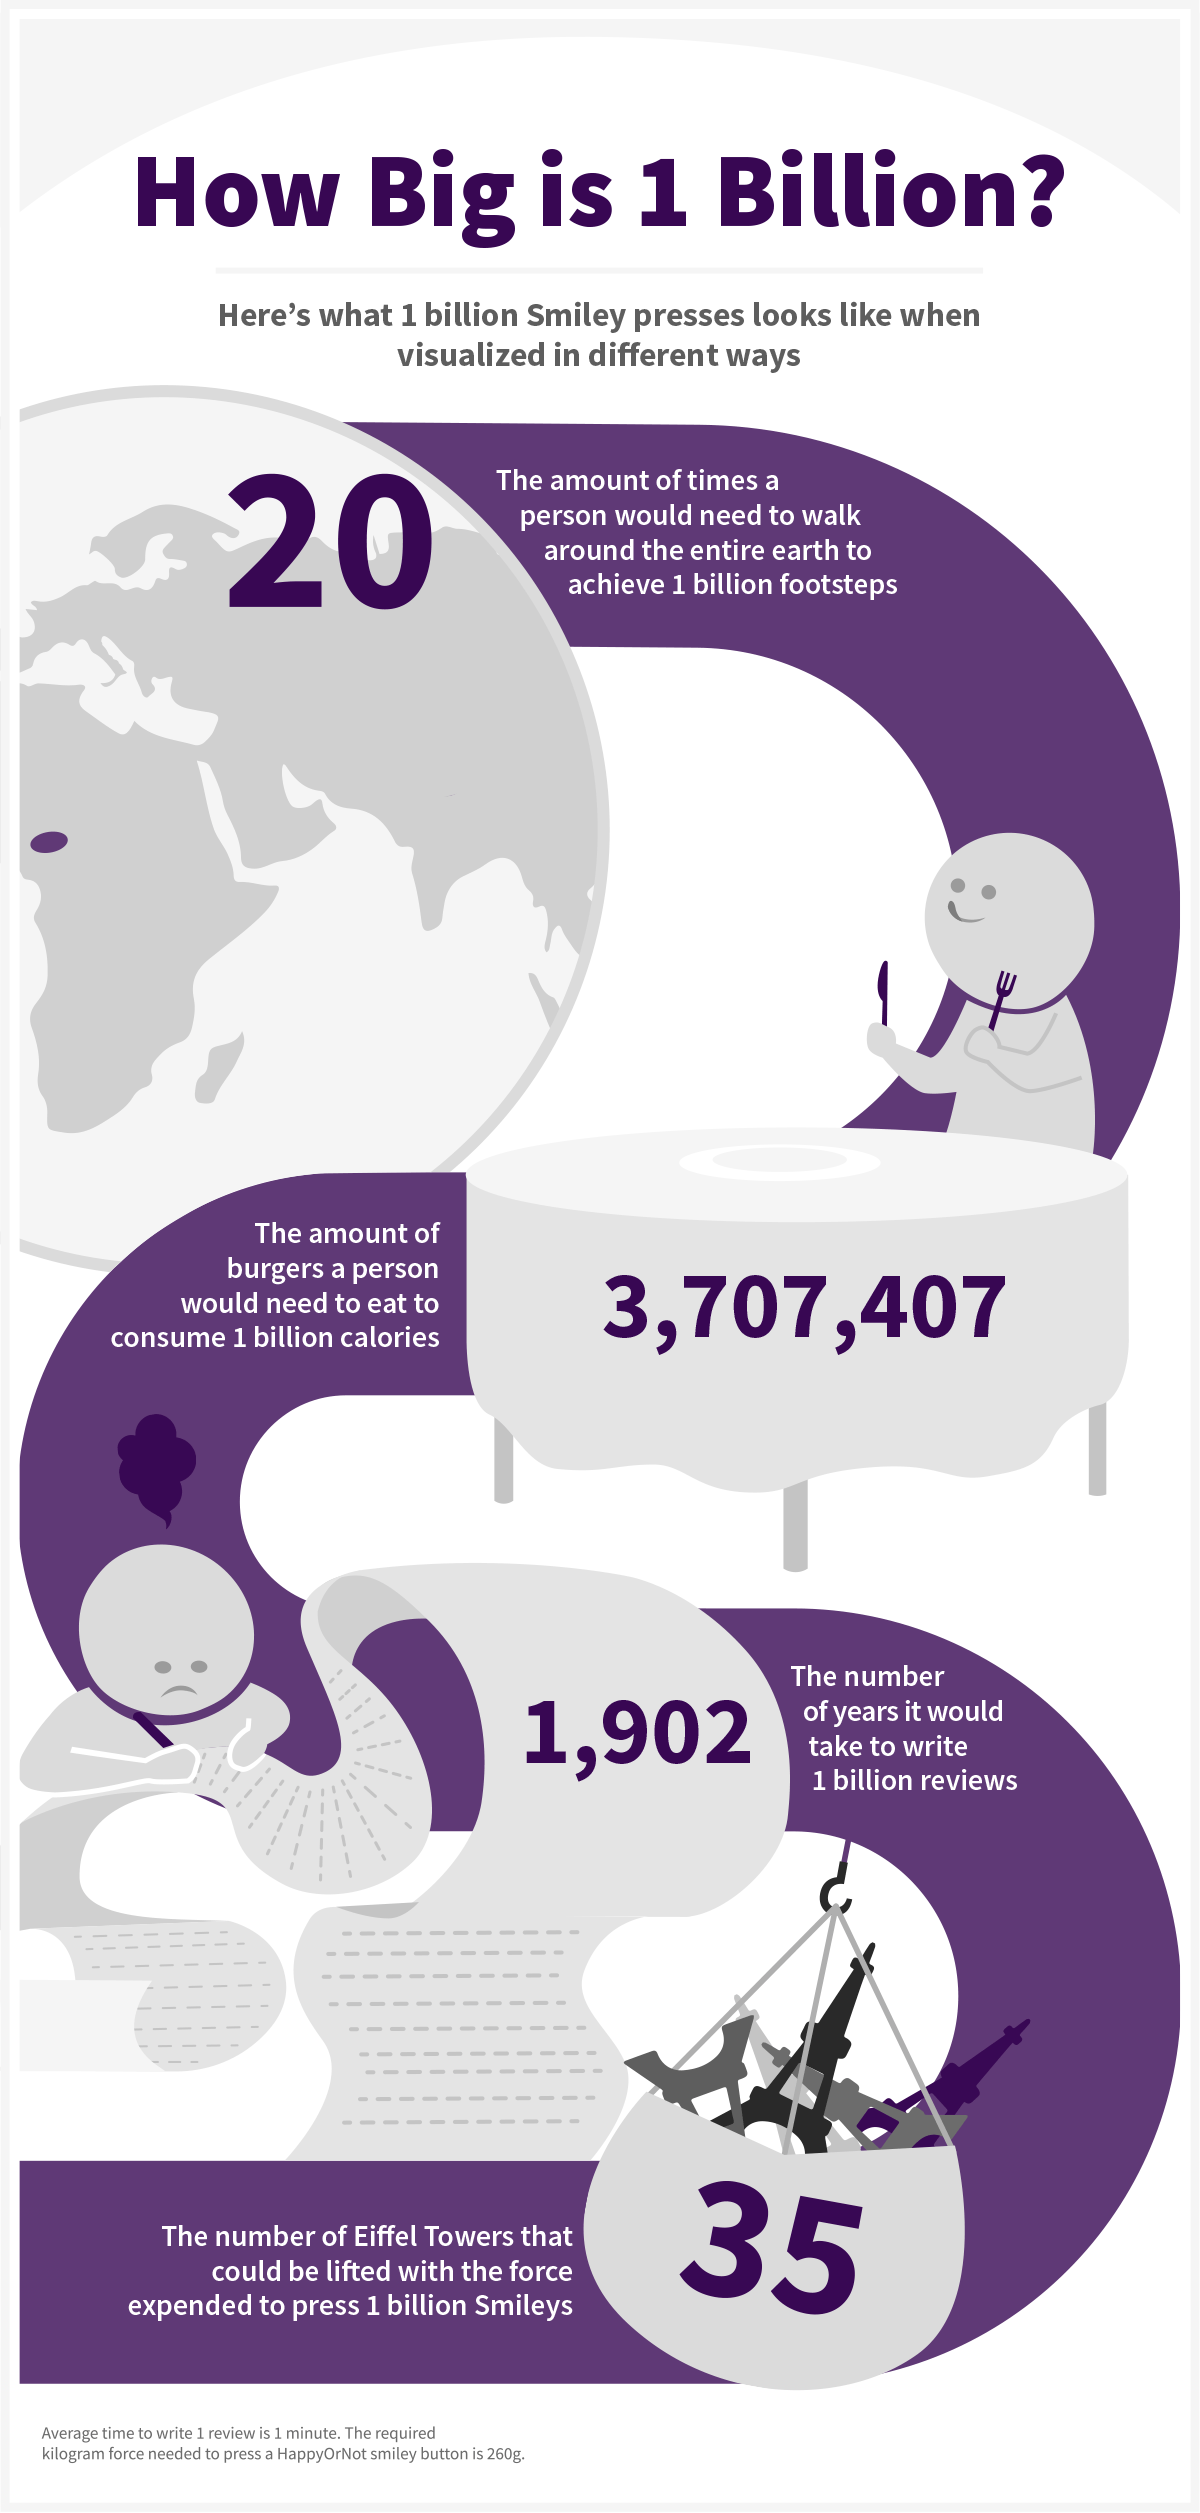
Lastly… How BIG is 1 Billion, Really?
To contextualize 1 billion customer voices: traditional receipt-based and online surveys usually have a response rate of less than 2% – meaning 50 billion people would need to be sent surveys to generate the same amount of feedback. Here’s a fun way we’ve demonstrated just how big 1 billion really is: